Optimization Considerations: Measure at the Browser
Update April 2016: This is a blog post I wrote in March 2015 with a poor title that’s still full of relevant transmission and client-side performance optimizations. It walks through the things I look at when optimizing a pageload, and most of these approaches apply to any web application. I am simply using my blog as a case study here because it’s a simple, open source case study we can walk though together.
This week I took a few days and re-built my blog. It was previously a WordPress instance on a small host with CloudFlare in front. It is now a statically generated, open source, managed via git, hosted on GitHub pages, and still proxied through CloudFlare. This post is my attempt to explain my reasoning and process in optimizing it along the way.
Why?
I couldn’t do what I wanted with WordPress, at least…not without a fight. I want to do several posts with interactive elements such as charts, maps, simulations, directly included CSV data, etc. to compare a lot of numbers I’ll be throwing out about some major infrastructure changes we’re making over at Stack Exchange. Here’s a quick example of many things I want to do in future posts. That was my motivation. When I looked into what I needed to change to support these things (besides even the basic editor fighting me along the way), I also took a long look at how the blog was performing. It was heavy…very heavy, as most WordPress installs tend to be. As a result, it was slow. Here’s what my blog looked like before the do-over:

Let’s start with the job, what’s actually happening here? Well…not much. I’m serving the same HTML to many people, many times. It’s usually around 60,000 hits a day when a post gets love. The comments are powered by Disqus and my impression counts are tracked by Google Analytics. All of the action happens client-side with both. The HTML is identical for every user. That’s the big point: what the server needs to send to the client is the same for every user. The post content, list of posts, archives, etc. change only when I add post, correct a post, or make a content tweak. Between those events, everything is static.
While I do love that people find my posts worth reading, I don’t love rendering or processing them 60,000 times. On top of that, my theme and setup didn’t lend itself to performance. My job and passion (I’m lucky: it’s both) is optimization. I make websites. Really fast websites. Why should my blog be any different? I believe nickcraver.com should be representative of who I am, in both content and purpose. It must be fast.
In my experience from both Stack Overflow questions and from my awesome co-workers is that most programmers’ first thought on performance seems to be: “how do I make it go faster?” It’s a valid question, and a great place to start. When you ask for details though, they’re usually talking about server-side rendering. Why? because programmers are big on numbers, and those are numbers they can easily measure. With tools like Miniprofiler available, you can even see that number in the corner of every page load (yes, we do this on Stack Overflow for developers). I used to approach things the same way. Then, I zoomed out.
Does a user care how fast your server renders the page? Nope. Not at all. Not one bit.
They care about how fast they load the page, or more accurately how fast they feel it loaded. Granted, some users don’t care at all, but most of us love our grandparents anyway.
You know what I learned about Stack Overflow when I started tracking client timings about a year ago? Our server render times for a great many users are a very, very small percentage of the load time a client experiences. We now render question pages in 10-15ms. What does that matter to an Australian user loading the page in 400-500ms? I don’t know, they probably died to spiders or scorpions while waiting for their page to load. Think about at those numbers. 96 to 98% of the time a user spends getting our HTML is outside our data center. The fact that our hardware upgrade dropped render times from 30-35ms down to 10-15ms doesn’t really help much. As one of the guys building Stack Overflow and making it fast: ouch.
That’s one harsh dose of reality. Knowing the bigger picture, I now start diagnosing performance of websites from the client side - the only one that matters to most users. Revamping my website was an exercise in this.
The Old
The first thing I do is get a baseline. This is an important step. Don’t start making changes until you’ve measured. If you haven’t measured, what are you “fixing”? When have you “fixed” it? What was Johnny rebelling against?
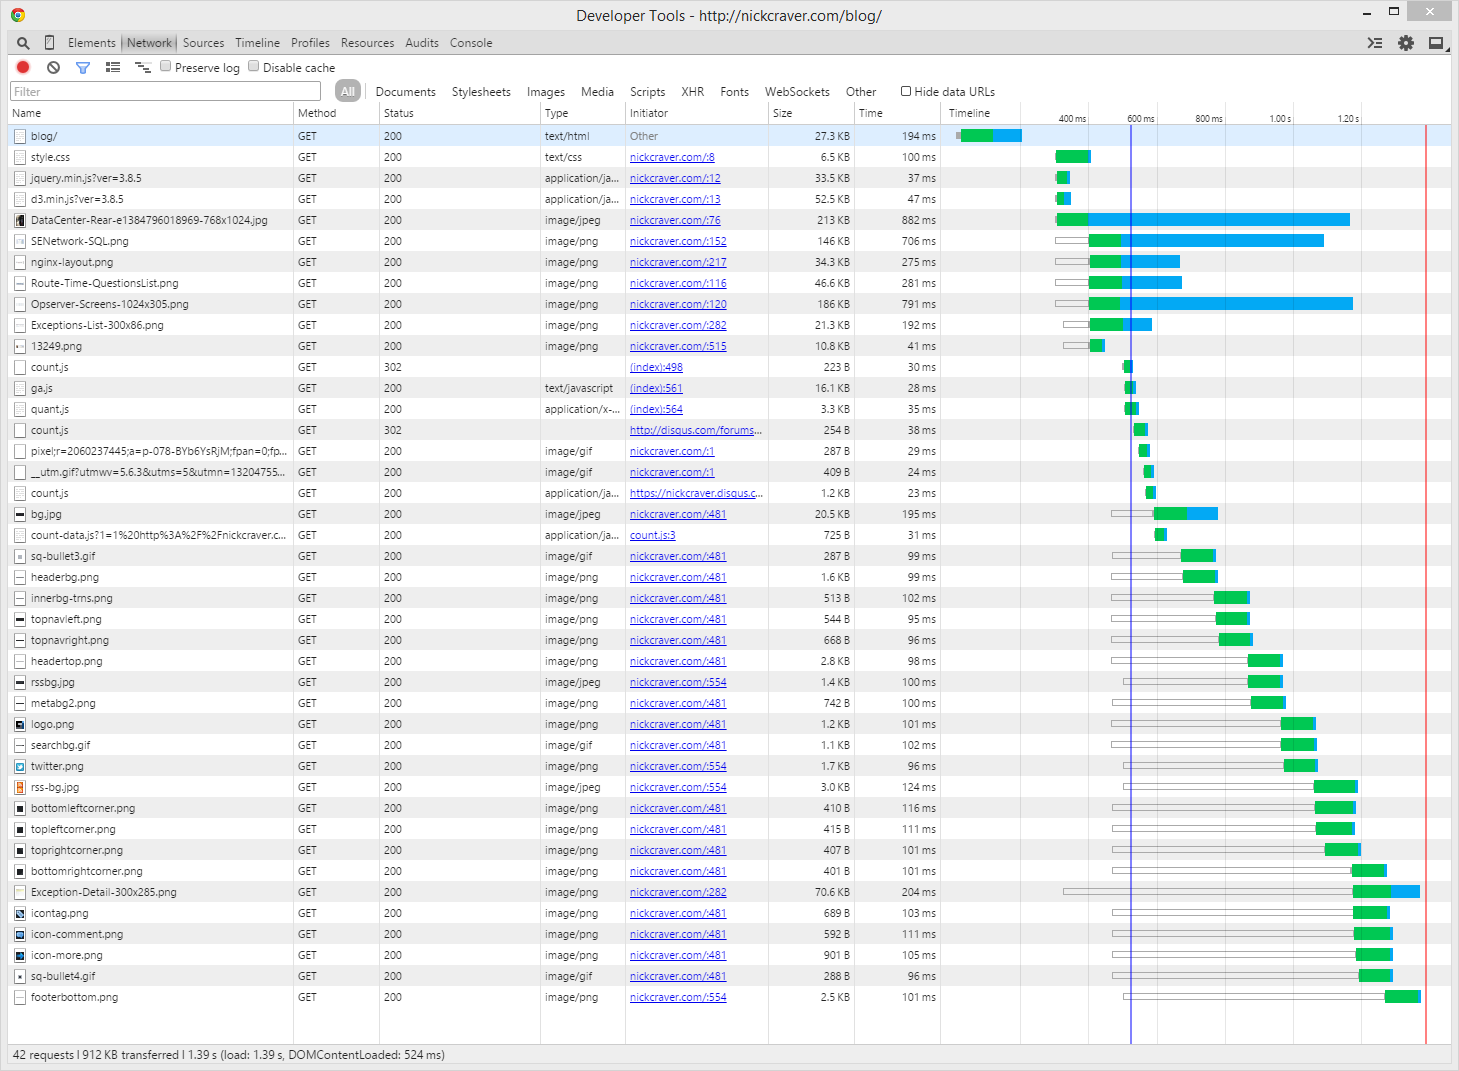
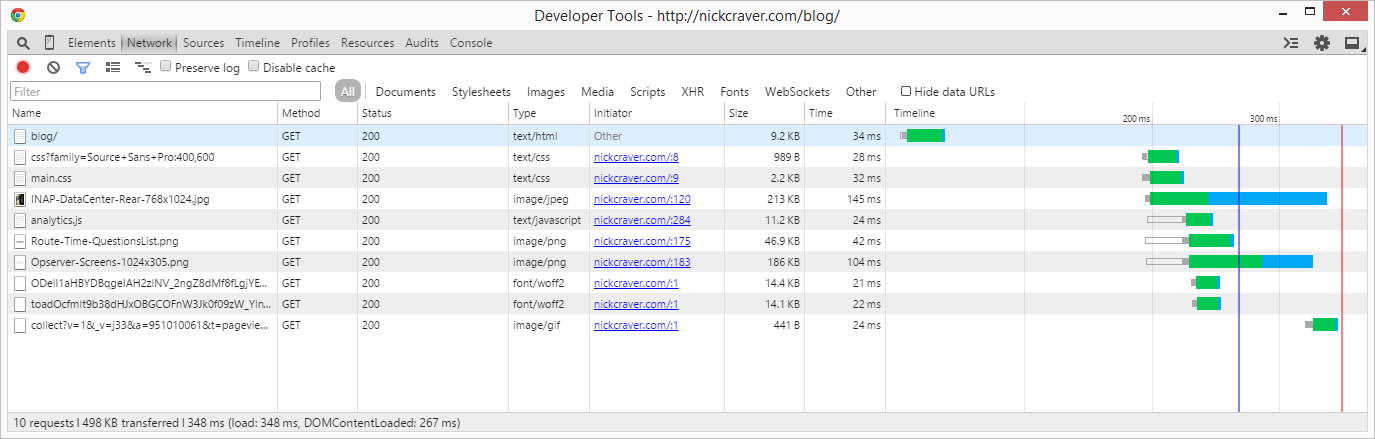
This was my old blog on a first page hit:
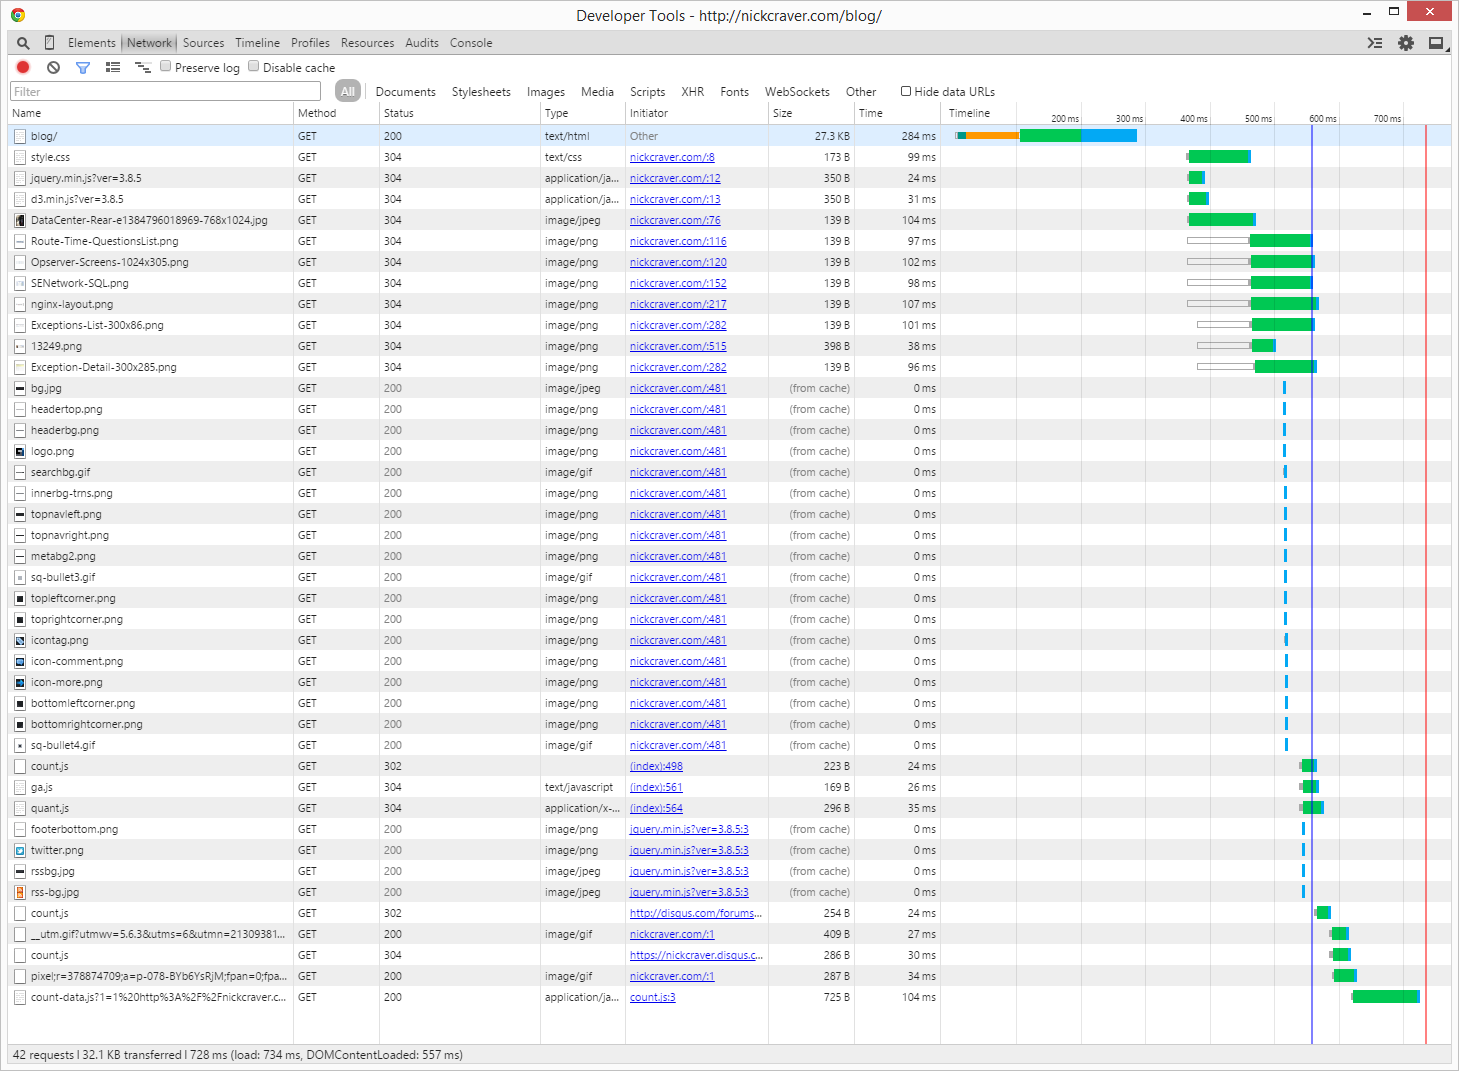
…and on a second hit:
Whelp. That sucks. Let’s look at the important pieces:
- 194ms to get HTML
- 100ms to get CSS
- 42 request totaling 912KB (only 6 of which are blog post images)
- 524ms to
DOMContentLoaded - 1.39s to
load
A reload is better especially on load down to 728ms due to those many, many images my theme used.
Okay, I said I start with the client timings. That’s true. Now we see that the server side rendering and delivery (194ms) is 37% of the initial render time (even after that images are still coming in, re-painting the page). 37% is worth taking a look at. Let’s go extreme and throw out WordPress. It’s rendering or processing every request to some degree - if only to see that I’m an administrator logged in doing things. I don’t need that, let’s get rid of it.
I start with a simple truth:
Q: What is the fastest operation you can perform?
A: Nothing. Doing nothing is always faster than doing something.
Don’t do something 10,000 times if the result is always the same. Do it once and keep using the result. On Stack Overflow (and most everywhere else), this is simply called cache. On my blog, it’s static generation via Jekyll. Note that where you cache matters - are you storing a data structure and still transforming it to HTML every time? Do you really need to do that? Storing HTML may seem rudimentary, but it’s very effective.
The New
First, I want to thank both Jin Yang (@jzy) for helping tremendously on design and SVG images and also Jon Chan, a great developer on the Careers team for actually convincing me of the static route with one of his internal projects you’ll hopefully see soon. Looking at that project finally motivated me to take the time and move my blog.
The Jekyll approach is simple: take some templates and content, process them once, and spit out a static site. GitHub will even host it (for free). This means I can also maintain the entire site on GitHub. I can even take pull requests for corrections. Look, I got one already! I’m all about open source, so this works out great.
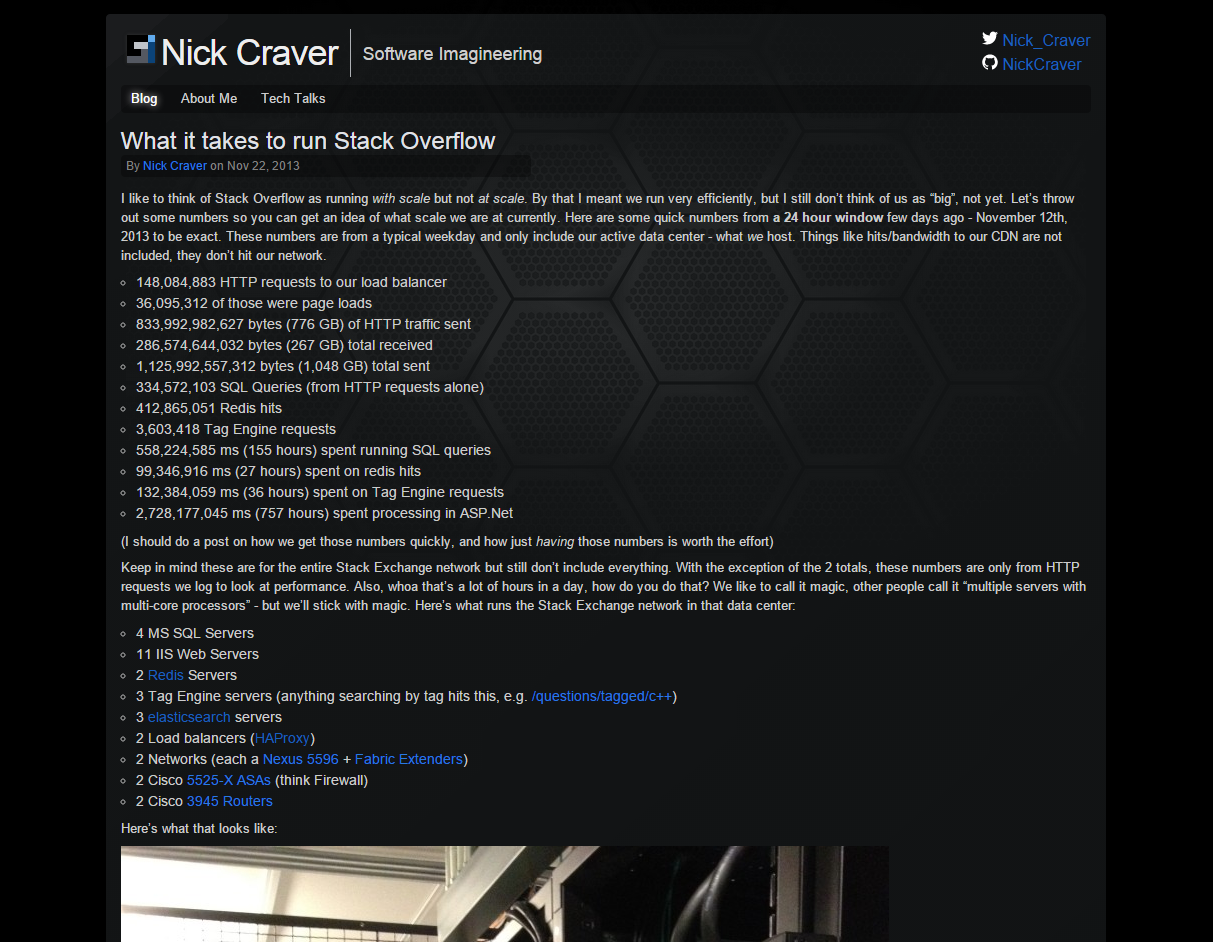
Maybe it’s subconsciously thinking about performance, but I love a minimal look and feel. That goes well with performance. Here’s what I made on the first pass:
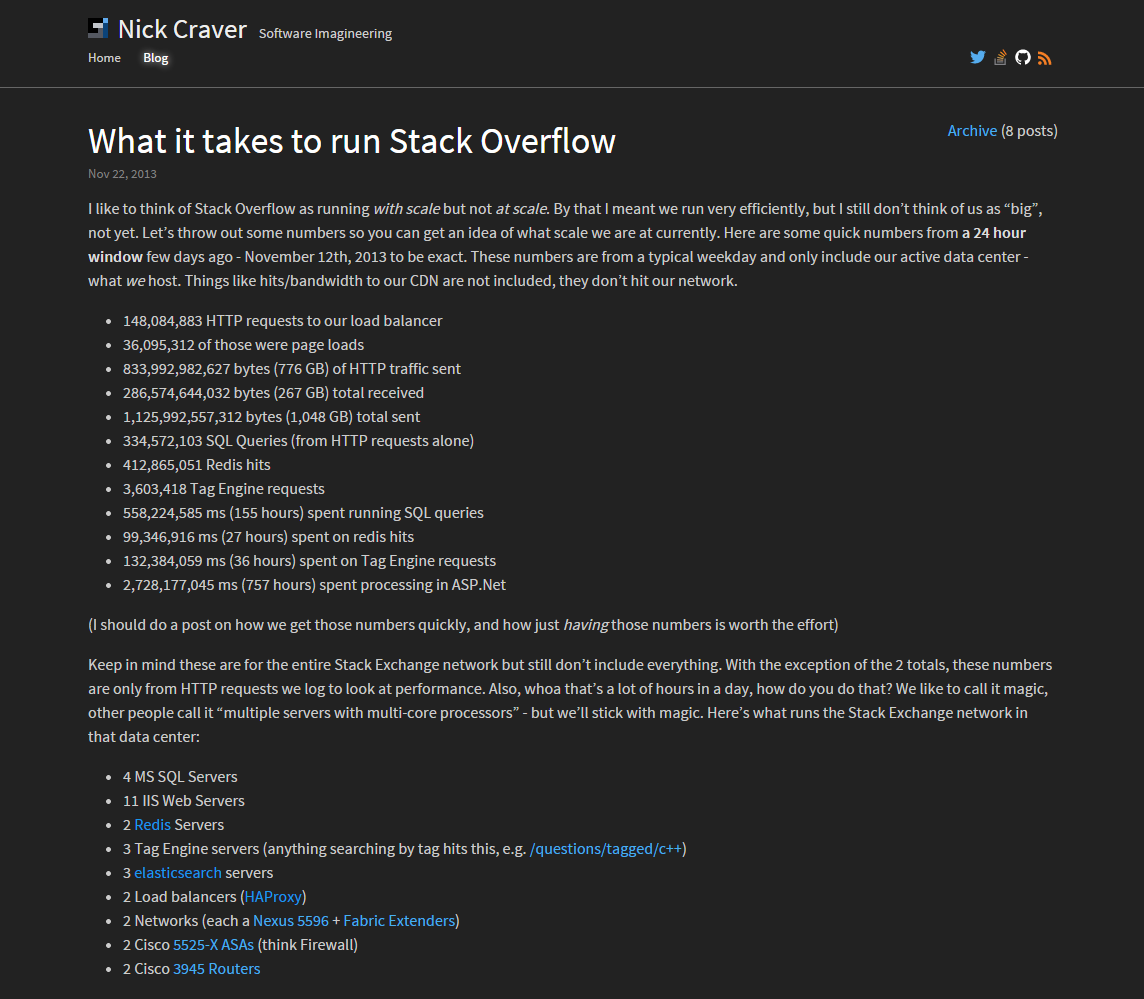
Then, I poked Jin for help. He’s my co-worker, friend, and awesome designer. What you see now if what we ended up with (and will continue tweaking in the future):
Let’s look at it by the numbers. When doing performance optimization, you have to compare to previous numbers. Here’s what the new blog comes in at on the first hit:
…and the second hit:
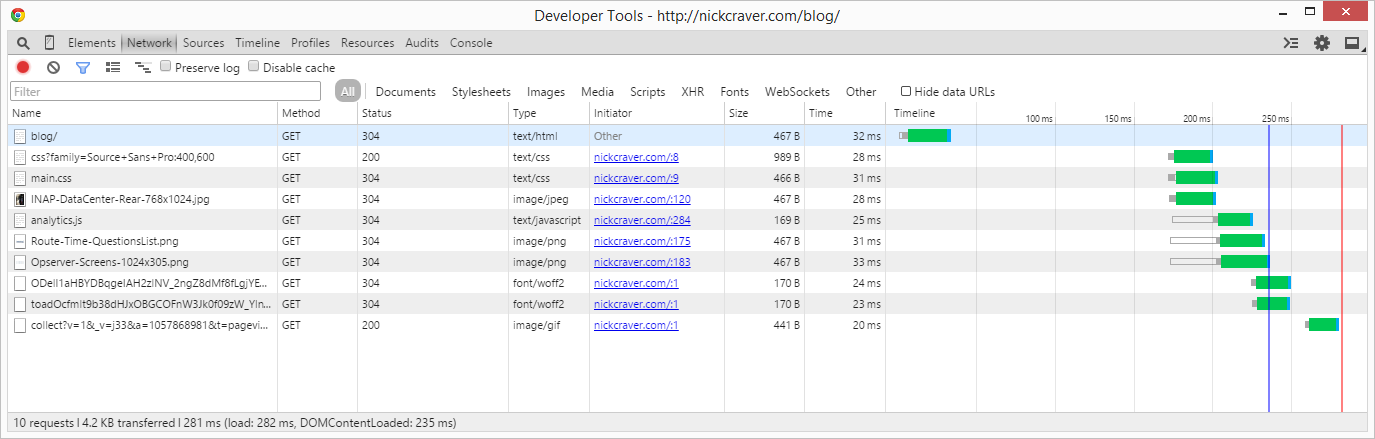
That’s looking better. The first hit now has a DOMContentLoaded of 267ms and a load event at 348ms. Compared to the previous load of 1,390ms, we’re talking about a first hit reduction of 1,123ms or 80.8%.
I know what you’re thinking. “Hey Nick, what about all those other blog post images? You’re cheating!”. To you I say: absolutely. Performance is all about cheating. Why do you think it’s so much fun for me? To be honest though, they don’t matter much. They didn’t affect the overall load time much as you can see in the timeline breakdown and where they start & stop.
Making it faster consists of 2 stages for me:
- Remove what you don’t need.
- Make what’s left faster.
The Breakdown
Let’s consider my audience, not dissimilar from most others blogs aside from the fact that you guys and gals are likely viewing my HTML source. And I bet a few more are now. What does the average blog audience do on the spiky medium-traffic posts like I usually have? They’re mostly first-hit traffic. They also very likely care about only the latest post they were linked directly to from Twitter, Reddit, Hacker News, etc. Some will browse around, but the majority come, read, and leave. That means I should optimize for the first hit. How do I know this, did I guess? No. Didn’t we just discuss measuring? Google Analytics tells me:
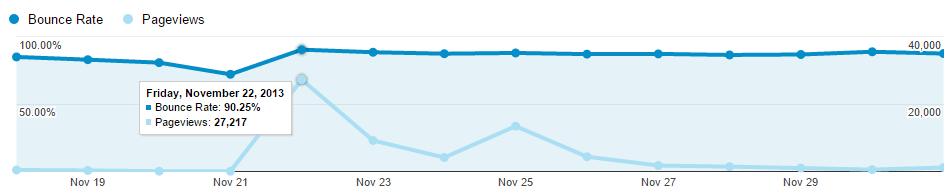
Even on a high traffic day of ~20-30k hits, the bounce rate is pretty stable. To support this 90% use case, I need not display the full posts on the home page and all of the potential image weight that comes with them. That’s 4 requests for images and 18.1KB of HTML gone.
I also control my own theme. Unlike some other projects where I’m implementing someone else’s can’t-change design, I can tune both the implementation and design itself here. Awesome. Jin knows programming as well, that helps tremendously here. Changing the design means I can use CSS3 for the effects I want and discard a lot of images. That’s 23 requests gone, if we’re counting.
I used to measure traffic with both Quantcast and Google Analytics, but I really don’t need 2. I dropped Quantcast. That’s 3 requests (1 for the JavaScript and 1 to 2 more for analytics) gone.
jQuery and d3.js (on pages that don’t need them: most of them) can also be dropped. That’s 2 requests gone.
I decided comment counts on the post list didn’t matter, opting for them only on the post page itself. I was honestly 50/50 on this and may change my mind - leave me feedback! That’s 3 requests gone.
So far we’re down 35-36 requests of the overall 42. Not bad. What’s left?
We’re down to only 7 requests:
- HTML: 27.3KB
- style.css: 6.5KB
- ga.js: 16.1KB
- utm.gif (GA analytics tracker): 409B
- 3 images from the first blog post: 213KB, 46.9KB, and 186KB
We’ve completed step #1: remove what you don’t need. On to step #2.
The Optimization
Optimize what’s left: Let’s strip the HTML that’s not needed on every page. All that WordPress (by default - not that you can’t optimize it) bloat, including the unread post content on the home page means I can slim the HTML down. On the home page, it’s now down to 9.2KB.
Let’s stop and make a rather important point here. Hey, that’s only 18.1KB…what’s the big deal? I download multi-gigabyte ISOs for work, 18KB is nothing!
The 18.1KB size savings isn’t the issue, it’s that 9.2KB (plus headers) is under ~14.3KB and the previous 27.3KB is not. This costs time. Back in 1999 (yes, there was internet…ish in ‘99), the congestion window size (CWND) default was upped to 4 segments (approx. 4x1,460=5.7KB) via RFC 2581. Later, RFC 6928 increased it to 10 segments (approx. 10x1,460=14.3KB) (which Google uses - and any high performance site should look at). Ilya Grigorik has a pretty good description with more detail and you can read the full scientific reasoning here.
Why does this matter? because fitting the request inside the initial window means the client gets the entire content before it even needs to send an ACK to the server - it doesn’t need to wait on content or round trips related to the ACK. If it doesn’t fit inside the window, then the client needs to send an ACK and the server has to receive it before sending the next window (which exponentially increases, but still incurs the round-trip to do so).
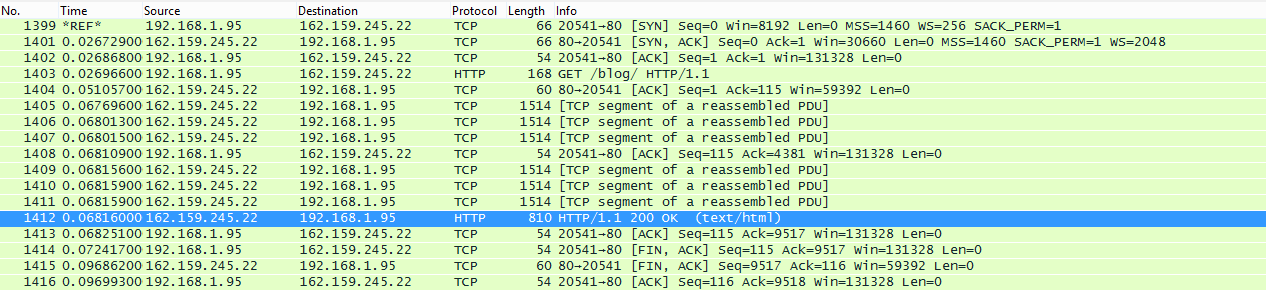
Here’s the old post list (/blog) and its 27.3KB of bloated glory, which took 267ms on this test:
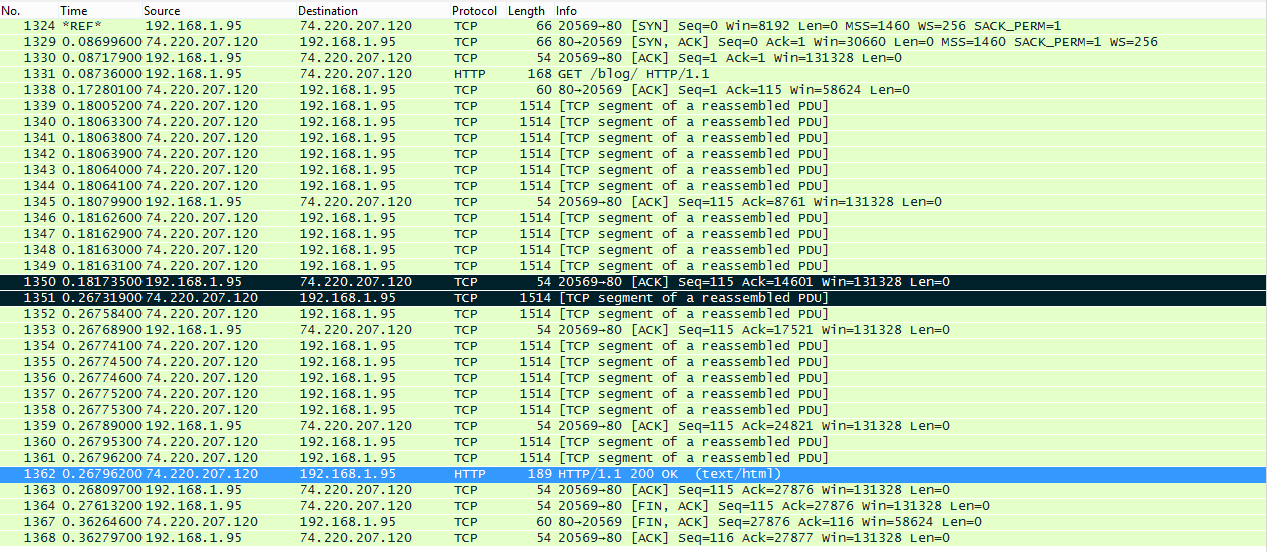
See those two black lines and the 86ms between? The second black line is the beginning of the second congestion window (you can see exactly 10 segments before it). It had to wait on the ACK from me (the first black line) before sending more data. That’s a round trip, ouch. Note: it’s not always synchronous from end of segment window to ACK to the next starting, it can overlap and be a less severe penalty.
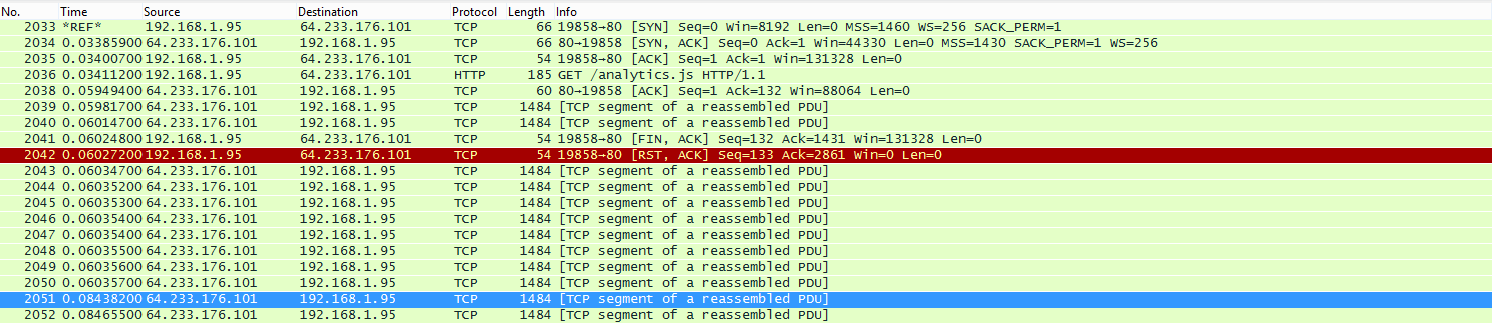
Here’s the new /blog weighting in at 9.2KB:
Hey that’s better! It’s only 6 segments, so when the server gets the request it can blast out the full response before asynchronously getting an ACK. This means while we’re telling the server “yep, got it!” the page is already there and content is preloading and rendering.
Next, I took the time to upgrade to Universal analytics which will soon be the GA standard. Why? Because it has more features and it slims down from the 16.1KB ga.js to the new 11.2KB analytics.js.
Well since we already sailed down for TCP boat river, so let’s see: how much time did we save here? Well, none. Because headers aren’t compressed and they send us over the initial 10 window anyway. You can see the last 2 rows here and the time gap where the server was waiting for an ACK (from earlier, in red) to send them along:
Note: HTTP2 does compress headers and SPDY does as well. This was me testing from a simple repeatable curl request which supports neither natively. It’s possible that with compressed headers we do actually fit in the initial windows with both versions. It matters little though, since this request doesn’t delay the page load or user experience.
I also changed the JavaScript include. Here’s what Google gives you:
<script>
  (function(i,s,o,g,r,a,m){i['GoogleAnalyticsObject']=r;i[r]=i[r]||function(){
  (i[r].q=i[r].q||[]).push(arguments)},i[r].l=1*new Date();a=s.createElement(o),
  m=s.getElementsByTagName(o)[0];a.async=1;a.src=g;m.parentNode.insertBefore(a,m)
  })(window,document,'script','//www.google-analytics.com/analytics.js','ga');

  ga('create', 'UA-XXXX-Y', 'auto');
  ga('send', 'pageview');
</script>
And here’s what I use:
<script async src='//www.google-analytics.com/analytics.js'></script>
<script>
  var ga=ga||function(){(ga.q=ga.q||[]).push(arguments)};ga.l=+new Date;
  ga('create','UA-XXXX-Y','auto');
  ga('send','pageview');
</script>
Why? Because it looks nicer and modern browsers can now preload that analytics.js. What’s the downside? IE9 doesn’t support the async attribute, which dynamically appending it side-steps and makes the fetch non-blocking anyway. Luckily, I don’t care. If you care about IE9, I advise you…uhhh….don’t do this.
Okay, so performance isn’t everything - it needs to be visually appealing. Usually that means images. Images mean more requests. Or do they? Nope, not today. There’s one obvious solution here: CSS image sprites. For instance, here’s the Stack Overflow image sprite. What’s better than that for me? No requests.
Remember my traffic consists largely of “view a page and leave” - we’re optimizing first hit here. See that logo in the upper left? It’s an SVG embedded right in the HTML, like this:
<svg class="logo" viewBox="0 0 4 4">
  <path fill="#000000" d="M0 0 h3 v1 h-2 v1 h1 v1 h-2 Z" />
  <path fill="#60aaed" d="M3 0 h1 v1 h-1 Z" />
  <path fill="#c0c4ca" d="M1 1 h2 v1 h-2 Z" />
  <path fill="#0b4379" d="M3 1 h1 v3 h-1 Z" />
  <path fill="#545861" d="M0 3 h2 v-1 h1 v2 h-3 Z" />
</svg>
You can see the logo embedded in the header here and the others in my social include here. With gzip compression these aren’t adding much to the page weight and they’re saving a request and rendering delay.
I trimmed the CSS (via SASS, the Jekyll default since it’s Ruby based) from 6.5KB to 2.2KB. This has more to do with minimalism than anything, but the site also works well on mobile as a result of the changes which include adding CSS media queries where needed. The net effect on load time is about nil, it was mostly cleanup.
It’s worth noting that the mobile friendly changes have an additional benefit in Google rankings starting April 21st. While my old blog had many issues, now we’re looking good.
The Proxy
Why use CloudFlare? Doesn’t GitHub pages do everything I need? Nope. While GitHub free hosting for pags is pretty good, it’s pretty limited to doing just that with no options. What I’m doing is pointing the root of nickcraver.com to GitHub with an @ CNAME to nickcraver.github.io. For those familiar with the rules: nope, this isn’t valid DNS to respond with…but you’re not getting a CNAME, you’re getting CloudFlare IPs on A records since it’s proxied through them. Here’s my current dig result:
nickcraver.com.     299 IN  A   162.159.245.22
nickcraver.com.     299 IN  A   162.159.244.22
This allows me do things to further increase performance. For example, I use CloudFlare’s page rules to change the cache header duration to an hour instead of 10 minutes (what GitHub uses) for most things. The control is very flexible (and getting better soon), but a simple longer cache is all I’m doing for now. They can also continue serving my pages from cache if the GitHub source is offline.
While I could control DNS from anywhere and CNAME to CloudFlare, using their name servers directly saves a DNS hop in first-hit situations. It’s important to distinguish here: it’s not your first hit as an individual user/browser combination that I’m normally referring to. It’s the first hit on your DNS server within my TTL. To see what I mean here we have to compare the options. Both options assume I want CloudFlare for in place for speed, DDoS protection, TLS support, etc.
- Option #1: CNAME to CloudFlare, CloudFlare pulls from GitHub - Result: CloudFlare IPs
- Option #2: Name servers to CloudFlare, CloudFlare pulls from GitHub - Result: CloudFlare IPs
So what’s the difference? Same result, right? Well first, Option #1 isn’t really even possible, you need the flattening I mentioned earlier. But let’s pretend we’re using a subdomain like blog.nickcraver.com that I could do it with. In Option #1, if you’re the first one on your local DNS server (could be in your office, ISP, etc.) after a cache expire the following has to happen:
- Where is
blog.nickcraver.com? Result: CNAME toblog.nickcraver.com.cdn.cloudflare.net - Ok, where is
blog.nickcraver.com.cdn.cloudflare.net? Result: A records:162.159.244.22,162.159.245.22 - Start establishing a connection to one of those IPs to load the site
Note: I excluded the possible additional performance penalty of your DNS server needing to lookup the SOA records for cloudflare.net before resolving the CNAME from those DNS servers, since CloudFlare’s big enough that it’s very unlikely to affect a significant percentage of requests.
Now Option #2, with the CNAME flattened:
- Where is
blog.nickcraver.com? Result: A records:162.159.244.22,162.159.245.22 - Start establishing a connection to one of those IPs to load the site
Since CloudFlare is immediately returning the IPs we need without that extra lookup in option #2, we’re saving time. To be fair, this won’t matter much for people on more popular or free DNS servers, like say the Google Public DNS. The speed gains are proportional to your miss rate, and you’re simply less likely to miss on a more popular server where someone else just did the same lookup causing a cache. It’s also likely that the CNAME in option #1 (depending on your mobility needs) has a much higher TTL than what it points to, so that lookup is less likely to happen than the second, again proportional to miss rate overall.
The Balance
Optimization isn’t about only minimizing page load times. If that was the case I’d have this: <html></html>. There’s a balance. You weigh how fancy, graphical, etc. something you want to be and optimize to that level. I wanted the blog to look a certain way, be consistent across OSes (since I use a PC during the day and a Retina MacBook Pro on the side and at night). For this reason and to keep some alignment issues consistent, Jin recommended a web font: Source Sans Pro.
The font adds one .css load and 1 to 2 web requests for font files (the .woff requests you see in my chrome timings). Yep, it does - but I think it’s worth it for the consistent and (IMO) better look.
I realize this post goes down several alleys in performance and decision detail, but my goal was to illustrate how these things matter on even a small simple site such as this. Hopefully, you find a little bit of it useful or at least interesting. In the coming weeks I’m going to focus a few posts on client times for page loads, and how we’re working on them for Stack Overflow and all Stack Exchange sites.
Oh and one last bit. If anyone’s doing a similar setup with CloudFlare in front of a static host and aggressive caching, you may find the following pre-push git hook handy:
#!/bin/sh

sleep 10s && curl https://www.cloudflare.com/api_json.html \
  -d 'a=fpurge_ts' \
  -d 'tkn=<insert API token>' \
  -d 'email=<insert email>' \
  -d 'z=<insert domain>' \
  -d 'v=1' &

exit 0
This auto-purges my site when I push to GitHub on a 10 second delay in the background. Note: it’s a global purge, so if you have a larger site it’s likely better to analyze which files are changing (you could base this on the _site directory) and purge only what’s changing. Hooks are scripts so you could go nuts here - I’m just sharing a simple hands-off nothing-to-remember approach.