Stack Overflow: How We Do App Caching - 2019 Edition
This is #5 in a very long series of posts on Stack Overflow’s architecture.
Previous post (#4): Stack Overflow: How We Do Monitoring - 2018 Edition
So…caching. What is it? It’s a way to get a quick payoff by not re-calculating or fetching things over and over, resulting in performance and cost wins. That’s even where the name comes from, it’s a short form of the “ca-ching!” cash register sound from the dark ages of 2014 when physical currency was still a thing, before Apple Pay. I’m a dad now, deal with it.
Let’s say we need to call an API or query a database server or just take a bajillion numbers (Google says that’s an actual word, I checked) and add them up. Those are all relatively crazy expensive. So we cache the result – we keep it handy for re-use.
Why Do We Cache?
I think it’s important here to discuss just how expensive some of the above things are. There are several layers of caching already in play in your modern computer. As a concrete example, we’re going to use one of our web servers which currently houses a pair of Intel Xeon E5-2960 v3 CPUs and 2133MHz DIMMs. Cache access is a “how many cycles” feature of a processor, so by knowing that we always run at 3.06GHz (performance power mode), we can derive the latencies (Intel architecture reference here – these processors are in the Haswell generation):
- L1 (per core): 4 cycles or ~1.3ns latency - 12x 32KB+32KB
- L2 (per core): 12 cycles or ~3.92ns latency - 12x 256KB
- L3 (shared): 34 cycles or ~11.11ns latency - 30MB
- System memory: ~100ns latency - 8x 8GB
Each cache layer is able to store more, but is farther away. It’s a trade-off in processor design with balances in play. For example, more memory per core means (almost certainly) on average putting it farther away on the chip from the core and that has costs in latency, opportunity costs, and power consumption. How far an electric charge has to travel has substantial impact at this scale; remember that distance is multiplied by billions every second.
And I didn’t get into disk latency above because we so very rarely touch disk. Why? Well, I guess to explain that we need to…look at disks. Ooooooooh shiny disks! But please don’t touch them after running around in socks. At Stack Overflow, anything production that’s not a backup or logging server is on SSDs. Local storage generally falls into a few tiers for us:
These numbers are changing all the time, so don’t focus on exact figures too much. What we’re trying to evaluate is the magnitude of the difference of these storage tiers. Let’s go down the list (assuming the lower bound of each, these are best case numbers):
- L1: 1.3ns
- L2: 3.92ns (3x slower)
- L3: 11.11ns (8.5x slower)
- DDR4 RAM: 100ns (77x slower)
- NVMe SSD: 120,000ns (92,307x slower)
- SATA/SAS SSD: 400,000ns (307,692x slower)
- Rotational HDD: 2–6ms (1,538,461x slower)
- Microsoft Live Login: 12 redirects and 5s (3,846,153,846x slower, approximately)
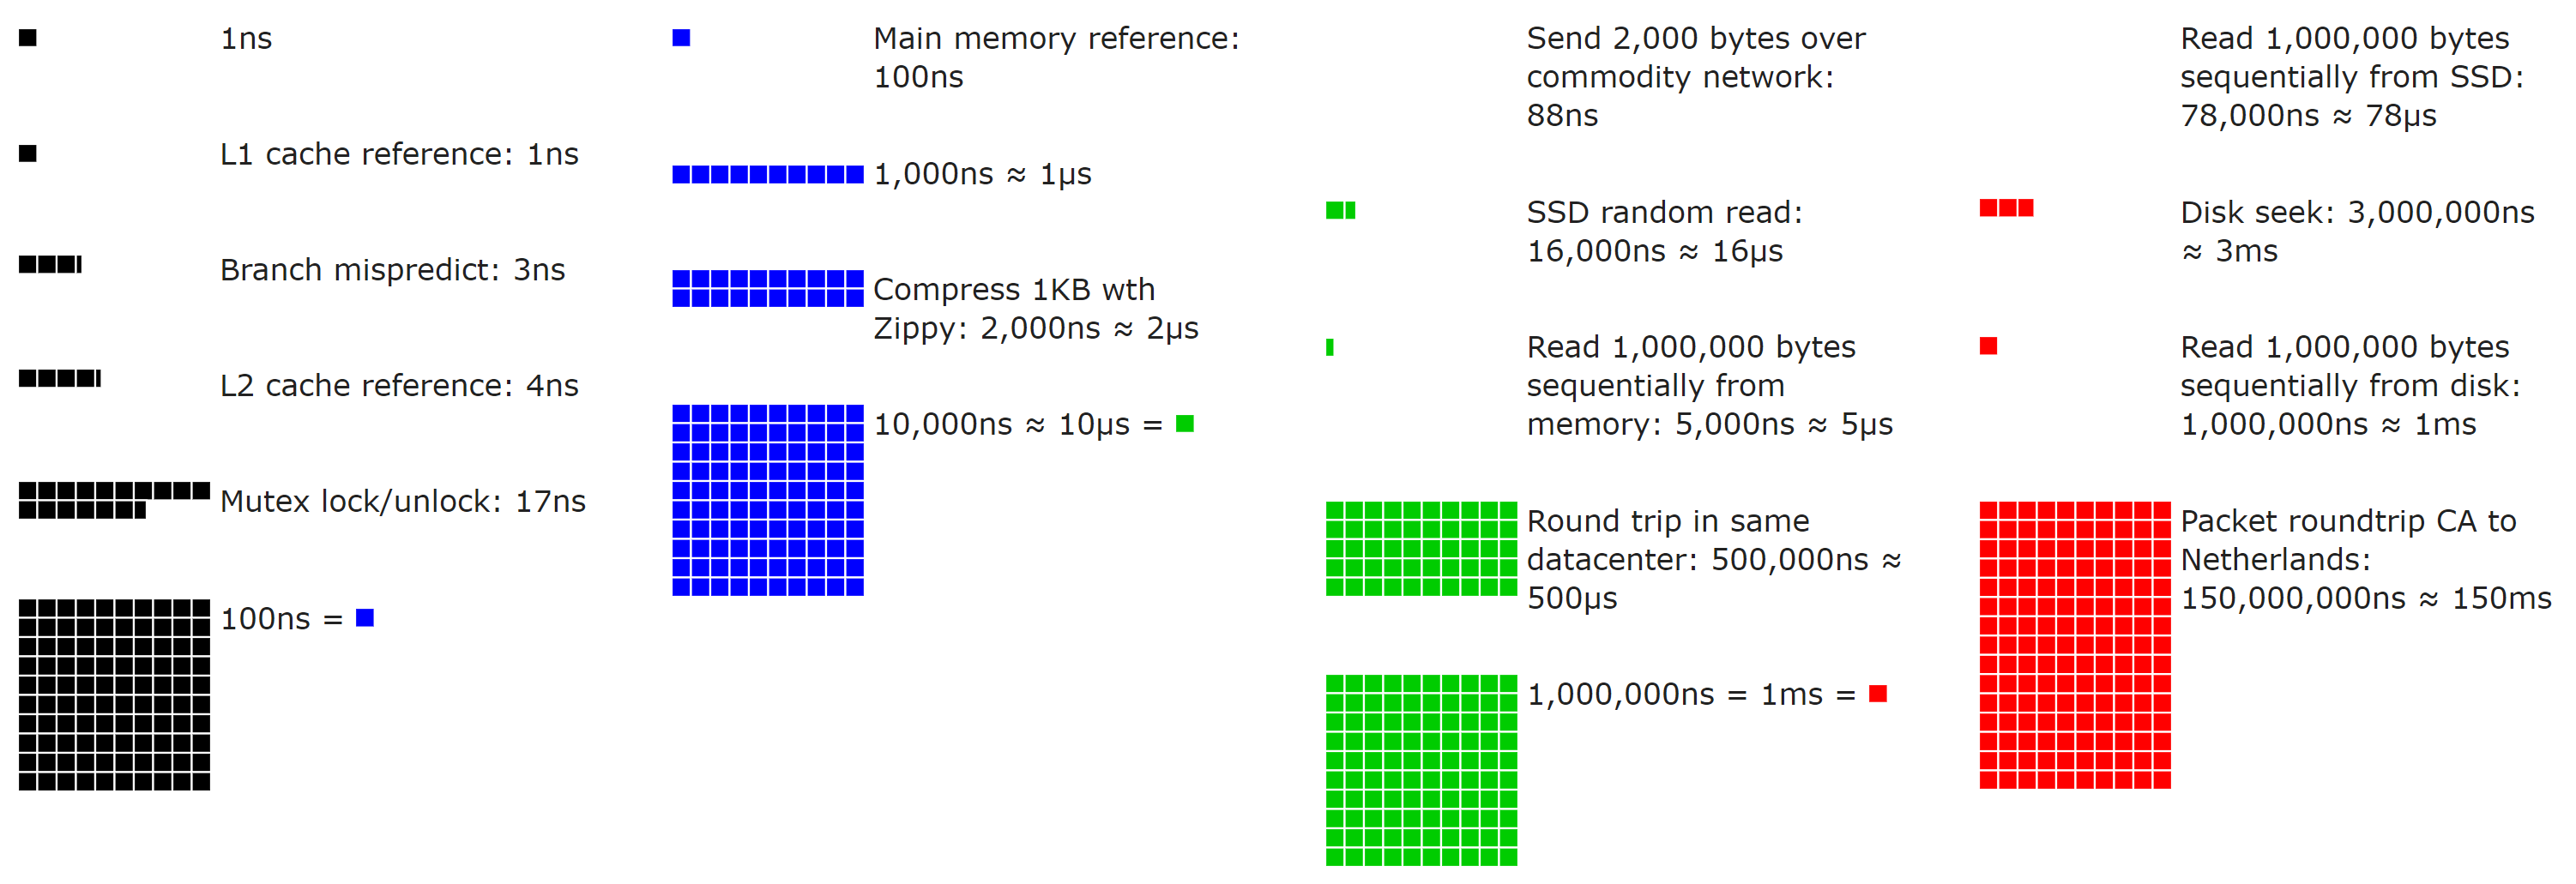
If numbers aren’t your thing, here’s a neat open source visualization (use the slider!) by Colin Scott (you can even go see how they’ve evolved over time – really neat):
With those performance numbers and a sense of scale in mind, let’s add some numbers that matter every day.
Let’s say our data source is X, where what X is doesn’t matter.
It could be SQL, or a microservice, or a macroservice, or a leftpad service, or Redis, or a file on disk, etc.
The key here is that we’re comparing that source’s performance to that of RAM.
Let’s say our source takes…
- 100ns (from RAM - fast!)
- 1ms (10,000x slower)
- 100ms (100,000x slower)
- 1s (1,000,000x slower)
I don’t think we need to go further to illustrate the point: even things that take only 1 millisecond are way, way slower than local RAM. Remember: millisecond, microsecond, nanosecond – just in case anyone else forgets that a 1000ns != 1ms like I sometimes do…
But not all cache is local. For example, we use Redis for shared caching behind our web tier (which we’ll cover in a bit). Let’s say we’re going across our network to get it. For us, that’s a 0.17ms roundtrip and you need to also send some data. For small things (our usual), that’s going to be around 0.2–0.5ms total. Still 2,000–5,000x slower than local RAM, but also a lot faster than most sources. Remember, these numbers are because we’re in a small local LAN. Cloud latency will generally be higher, so measure to see your latency.
When we get the data, maybe we also want to massage it in some way.
Probably Swedish.
Maybe we need totals, maybe we need to filter, maybe we need to encode it, maybe we need to fudge with it randomly just to trick you.
That was a test to see if you’re still reading. You passed!
Whatever the reason, the commonality is generally we want to do <x> once, and not every time we serve it.
Sometimes we’re saving latency and sometimes we’re saving CPU. One or both of those are generally why a cache is introduced. Now let’s cover the flip side…
Why Wouldn’t We Cache?
For everyone who hates caching, this is the section for you! Yes, I’m totally playing both sides.
Given the above and how drastic the wins are, why wouldn’t we cache something? Well, because every single decision has trade-offs. Every. Single. One. It could be as simple as time spent or opportunity cost, but there’s still a trade-off.
When it comes to caching, adding a cache comes with some costs:
- Purging values if and when needed (cache invalidation – we’ll cover that in a few)
- Memory used by the cache
- Latency of access to the cache (weighed against access to the source)
- Additional time and mental overhead spent debugging something more complicated
Whenever a candidate for caching comes up (usually with a new feature), we need to evaluate these things…and that’s not always an easy thing to do. Although caching is an exact science, much like astrology, it’s still tricky.
Here at Stack Overflow, our architecture has one overarching theme: keep it as simple as possible. Simple is easy to evaluate, reason about, debug, and change if needed. Only make it more complicated if and when it needs to be more complicated. That includes cache. Only cache if you need to. It adds more work and more chances for bugs, so unless it’s needed: don’t. At least, not yet.
Let’s start by asking some questions.
- Is it that much faster to hit cache?
- What are we saving?
- Is it worth the storage?
- Is it worth the cleanup of said storage (e.g. garbage collection)?
- Will it go on the large object heap immediately?
- How often do we have to invalidate it?
- How many hits per cache entry do we think we’ll get?
- Will it interact with other things that complicate invalidation?
- How many variants will there be?
- Do we have to allocate just to calculate the key?
- Is it a local or remote cache?
- Is it shared between users?
- Is it shared between sites?
- Does it rely on quantum entanglement or does debugging it just make you think that?
- What color is the cache?
All of these are questions that come up and affect caching decisions. I’ll try and cover them through this post.
Layers of Cache at Stack Overflow
We have our own “L1”/”L2” caches here at Stack Overflow, but I’ll refrain from referring to them that way to avoid confusion with the CPU caches mentioned above. What we have is several types of cache. Let’s first quickly cover local and memory caches here for terminology before a deep dive into the common bits used by them:
- “Global Cache”: In-memory cache (global, per web server, and backed by Redis on miss)
- Usually things like a user’s top bar counts, shared across the network
- This hits local memory (shared keyspace), and then Redis (shared keyspace, using Redis database 0)
- “Site Cache”: In-memory cache (per site, per web server, and backed by Redis on miss)
- Usually things like question lists or user lists that are per-site
- This hits local memory (per-site keyspace, using prefixing), and then Redis (per-site keyspace, using Redis databases)
- “Local Cache”: In-memory cache (per site, per web server, backed by nothing)
- Usually things that are cheap to fetch, but huge to stream and the Redis hop isn’t worth it
- This hits local memory only (per-site keyspace, using prefixing)
What do we mean by “per-site”? Stack Overflow and the Stack Exchange network of sites is a multi-tenant architecture. Stack Overflow is just one of many hundreds of sites. This means one process on the web server hosts all the sites, so we need to split up the caching where needed. And we’ll have to purge it (we’ll cover how that works too).
Redis
Before we discuss how servers and shared cache work, let’s quickly cover what the shared bits are built on: Redis. So what is Redis? It’s an open source key/value data store with many useful data structures, additional publish/subscriber mechanisms, and rock solid stability.
Why Redis and not <something else>?
Well, because it works. And it works well.
It seemed like a good idea when we needed a shared cache.
It’s been incredibly rock solid.
We don’t wait on it – it’s incredibly fast.
We know how it works.
We’re very familiar with it.
We know how to monitor it.
We know how to spell it.
We maintain one of the most used open source libraries for it.
We can tweak that library if we need.
It’s a piece of infrastructure we just don’t worry about. We basically take it for granted (though we still have an HA setup of replicas – we’re not completely crazy). When making infrastructure choices, you don’t just change things for perceived possible value. Changing takes effort, takes time, and involves risk. If what you have works well and does what you need, why invest that time and effort and take a risk? Well…you don’t. There are thousands of better things you can do with your time. Like debating which cache server is best!
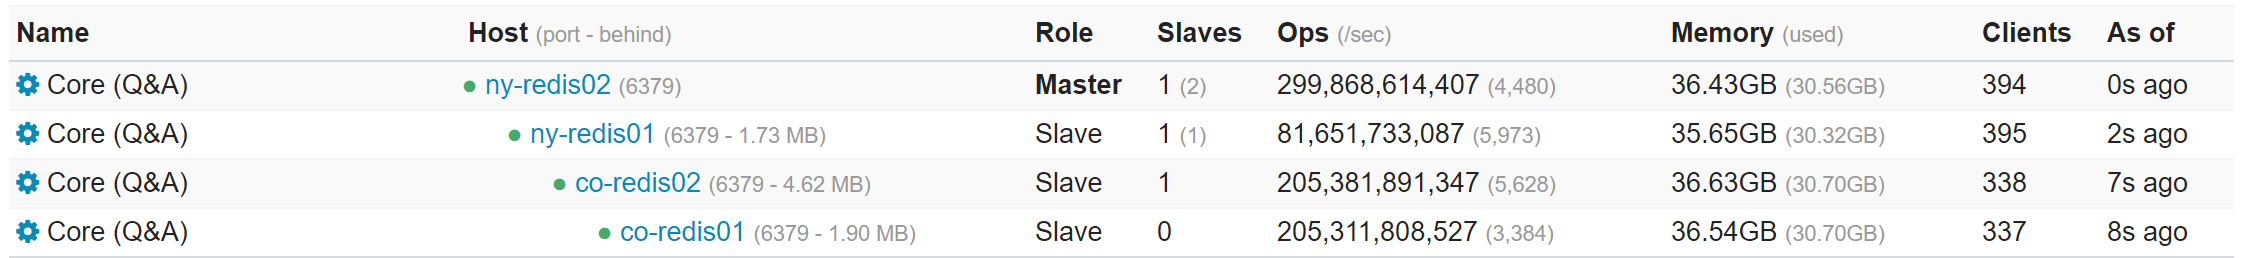
We have a few Redis instances to separate concerns of apps (but on the same set of servers), here’s an example of what one looks like:
For the curious, some quick stats from last Tuesday (2019-07-30) This is across all instances on the primary boxes (because we split them up for organization, not performance…one instance could handle everything we do quite easily):
- Our Redis physical servers have 256GB of memory, but less than 96GB used.
- 1,586,553,473 commands processed per day (3,726,580,897 commands and 86,982 per second peak across all instances – due to replicas)
- Average of 2.01% CPU utilization (3.04% peak) for the entire server (< 1% even for the most active instance)
- 124,415,398 active keys (422,818,481 including replicas)
- Those numbers are across 308,065,226 HTTP hits (64,717,337 of which were question pages)
Note: None of these are Redis limited – we’re far from any limits. It’s just how much activity there is on our instances.
There are also non-cache reasons we use Redis, namely: we also use the pub/sub mechanism for our websockets that provide realtime updates on scores, rep, etc. Redis 5.0 added Streams which is a perfect fit for our websockets and we’ll likely migrate to them when some other infrastructure pieces are in place (mainly limited by Stack Overflow Enterprise’s version at the moment).
In-Memory & Redis Cache
Each of the above has an in-memory cache component and some have a backup in that lovely Redis server.
In-memory is simple enough, we’re just caching things in…ya know, memory.
In ASP.NET MVC 5, this used to be HttpRuntime.Cache.
These days, in preparation for our ASP.NET Core move, we’ve moved on to MemoryCache.
The differences are tiny and don’t matter much; both generally provide a way to cache an object for some duration of time.
That’s all we need here.
For the above caches, we choose a “database ID”.
These relate to the sites we have on the Stack Exchange Network and come from our Sites database table.
Stack Overflow is 1, Server Fault is 2, Super User is 3, etc.
For local cache, you could approach it a few ways. Ours is simple: that ID is part of the cache key. For Global Cache (shared), the ID is zero. We further (for safety) prefix each cache to avoid conflicts with general key names from whatever else might be in these app-level caches. An example key would be:
prod:1-related-questions:1234
That would be the related questions in the sidebar for Question 1234 on Stack Overflow (ID: 1). If we’re only in-memory, serialization doesn’t matter and we can just cache any object. However, if we’re sending that cache object somewhere (or getting one back from somewhere), we need to serialize it. And fast! That’s where protobuf-net written by our own Marc Gravell comes in. Protobuf is a binary encoding format that’s tremendously efficient in both speed and allocations. A simple object we want to cache may look like this:
public class RelatedQuestionsCache
{
    public int Count { get; set; }
    public string Html { get; set; }
}
With protobuf attributes to control serialization, it looks like this:
[ProtoContract]
public class RelatedQuestionsCache
{
    [ProtoMember(1)] public int Count { get; set; }
    [ProtoMember(2)] public string Html { get; set; }
}
So let’s say we want to cache that object in Site Cache. The flow looks like this (code simplified a bit):
public T Get<T>(string key)
{
    // Transform to the shared cache key format, e.g. "x" into "prod:1-x"
    var cacheKey = GetCacheKey(key);
    // Do we have it in memory?
    var local = memoryCache.Get<RedisWrapper>(cacheKey);
    if (local != null)
    {
        // We've got it local - nothing more to do.
        return local.GetValue<T>();
    }
    // Is Redis connected and readable? This makes Redis a fallback and not critical
    if (redisCache.CanRead(cacheKey)) // Key is passed here for the case of Redis Cluster
    {
    	var remote = redisCache.StringGetWithExpiry(cacheKey)
        if (remote.Value != null)
        {
            // Get our shared construct for caching
       	    var wrapper = RedisWrapper.From(remote);
            // Set it in our local memory cache so the next hit gets it faster
            memoryCache.Set<RedisWrapper>(key, wrapper, remote.Expiry);
            // Return the value we found in Redis
            return remote.Value;
        }
    }
    // No value found, sad panda
    return null;
}
Granted, this code is greatly simplified to convey the point, but we’re not leaving anything important out.
Why a RedisWrapper<T>?
It synonymizes platform concepts by having a value with a TTL (time-to-live) with the value, just like Redis does.
It also allows the caching of a null value and makes that handling not special-cased.
In other words, you can tell the difference between “It’s not cached” and “We looked it up. It was null. We cached that null. STOP ASKING!”
If you’re curious about StringGetWithExpiry, it’s a StackExchange.Redis method that returns the value and the TTL in one call by pipelining the commands (not 2 round-trip time costs).
A Set<T> for caching a value works exactly the same way:
- Cache the value in memory.
- Cache the same value in Redis.
- (Optionally) Alert the other web servers that the value has been updated and instruct them to flush their copy.
Pipelining
I want to take a moment and relay a very important thing here: our Redis connections (via StackExchange.Redis) are pipelined.
Think of it like a conveyor belt you can stick something on and it goes somewhere and circles back.
You could stick thousands of things in a row on that conveyor belt before the first reaches the destination or comes back.
If you put a giant thing on there, it means you have to wait to add other things.
The items may be independent, but the conveyor belt is shared. In our case, the conveyor belt is the connection and the items are commands. If a large payload goes on or comes back, it occupies the belt for a bit. This means if you’re waiting on a specific thing but some nasty big item clogs up he works for a second or two, it may cause collateral damage. That’s a timeout.
We often see issues filed from people putting tremendous many-megabyte payloads into Redis with low timeouts, but that doesn’t work unless the pipe is very, very fast. They don’t see the many-megabyte command timing out…they usually see things waiting behind it timing out.
It’s important to realize that a pipeline is just like any pipe outside a computer. Whatever its narrowest constraint is, that’s where it’ll bottleneck. Except this is a dynamic pipe, more like a hose that can expand or bend or kink. The bottlenecks are not 100% constant. In practical terms, this can be thread pool exhaustion (either feeding commands in or handling them coming out). Or it may be network bandwidth. And maybe something else is using that network bandwidth impacting us.
Remember that at these levels of latency, viewing things at 1Gb/s or 10Gb/s isn’t really using the correct unit of time. For me, it helps to not think in terms of 1Gb/s, but instead in terms of 1Mb/ms. If we’re traversing the network in about a millisecond or less, that payload really does matter and can increase the time taken by very measurable and impactful amounts. That’s all to say: think small here. The limits on any system when you’re dealing with short durations must be considered with relative constraints proportional to the same durations. When we’re talking about milliseconds, the fact that we think of most computing concepts only down to the second is often a factor that confuses thinking and discussion.
Pipelining: Retries
The pipelined nature is also why we can’t retry commands with any confidence. In this sad world our conveyor belt has turned into the airport baggage pickup loopy thingamajig (also in the dictionary, for the record) we all know and love.
You put an bag on the thingamajig. The bag contains something important, probably some really fancy pants. They’re going to someone who you wanted to impress. (We’re using airport luggage as a very reasonably priced alternative to UPS in this scenario.) But Mr. Fancy Pants is super nice and promised to return your bag. So nice. You did your part. The bag went on the thingamajig and went out of sight…and never make it back. Okay…where did it go?!? We don’t know! DAMN YOU BAG!
Maybe the bag made it to the lovely person and got lost on the return trip. Or maybe it didn’t. We still don’t know! Should we send it again? What if we’re sending them a second pair of fancy pants? Will they think we think they spill ketchup a lot? That’d be weird. We don’t want to come on too strong. And now we’re just confused and bagless. So let’s talk about something that makes even less sense: cache invalidation.
Cache Invalidation
I keep referring to purging above, so how’s that work?
Redis has a pub/sub feature where you can push a message out and subscribers all receive it (this message goes to all replicas as well).
Using this simple concept, we can simply have a cache clearing channel we SUBSCRIBE to.
When we want to remove a value early (rather than waiting for TTLs to fall out naturally), we just PUBLISH that key name to our channel and the listener (think event handler here) just purges the key from local cache.
The steps are:
- Purge the value from Redis via
DELorUNLINK. Or, just replace the value with a new one…whatever state we’re after. - Broadcast the key to the purge channel.
Order is important, because reversing these would create a race and end up in a re-fetch of the old value sometimes. Note that we’re not pushing the new value out. That’s not the goal. Maybe web servers 1–5 that had the value cache won’t even ask for it again this duration…so let’s not be over-eager and wasteful. All we’re making them do is get it from Redis if and when it’s asked for.
Combining Everything: GetSet
If you look at the above, you’d think we’re doing this a lot:
var val = Current.SiteCache.Get<string>(key);
if (val == null)
{
    val = FetchFromSource();
    Current.SiteCache.Set(key, val, Timespan.FromSeconds(30));
}
return val;
But here’s where we can greatly improve on things.
First, it’s repetitive. Ugh.
But more importantly, that code will result in hundreds of simultaneous calls to FetchFromSource() at scale when the cache expires.
What if that fetch is heavy?
Presumably it’s somewhat expensive, since we’ve decided to cache it in the first place.
We need a better plan.
This is where our most common approach comes in: GetSet<T>().
Okay, so naming is hard.
Let’s just agree everyone has regrets and move on.
What do we really want to do here?
- Get a value if it’s there
- Calculate or fetch a value if it’s not there (and shove it in cache)
- Prevent calculating or fetching the same value many times
- Ensure users wait as little as possible
We can use some attributes about who we are and what we do to optimize here. Let’s say you load the web page now, or a second ago, or 3 seconds from now. Does it matter? Is the Stack Overflow question going to change that much? The answer is: only if there’s anything to notice. Maybe you made an upvote, or an edit, or a comment, etc. These are things you’d notice. We must refresh any caches that pertain to those kinds of activities for you. But for any of hundreds of other users simultaneously loading that page, skews in data are imperceptible.
That means we have wiggle room. Let’s exploit that wiggle room for performance.
Here’s what GetSet<T> looks like today (yes, there’s an equivalent-ish async version):
public static T GetSet<T>(
    this ImmediateSiteCache cache,
    string key,
    Func<T, MicroContext, T> lookup,
    int durationSecs,
    int serveStaleDataSecs,
    GetSetFlags flags = GetSetFlags.None,
    Server server = Server.PreferMaster)
The key arguments to this are durationSecs and serveStaleDataSecs.
A call often looks something like this (it’s a contrived example for simplicity of discussion):
var lookup = Current.SiteCache.GetSet<Dictionary<int, string>>("User:DisplayNames",
   (old, ctx) => ctx.DB.Query<(int Id, string DisplayName)>("Select Id, DisplayName From Users")
                       .ToDictionary(i => i.Id),
    60, 5*60);
This call goes to the Users table and caches an Id -> DisplayName lookup (we don’t actually do this, I just needed a simple example).
The key part is the values at the end.
We’re saying “cache for 60 seconds, but serve stale for 5 minutes”.
The behavior is that for 60 seconds, any hits against this cache only return it. But we keep the value in memory (and Redis) for 6 minutes total. In the time between 60 seconds and 6 minutes (from the time cached), we’ll happily still serve the value to users. But, we’ll kick off a background refresh on another thread at the same time so future users get a fresh value. Rinse and repeat.
Another important detail here is we keep a per-server local lock table (a ConcurrentDictionary) that prevents two calls from trying to run that lookup function and getting the value at the same time.
For example, there’s no win in querying the database 400 times for 400 users.
Users 2 though 400 are better off waiting on the first cache to complete and our database server isn’t kinda sorta murdered in the process.
Why a ConcurrentDictionary<string, object> instead of say a HashSet<string>?
Because we want to lock on the object in that dictionary for subsequent callers.
They’re all waiting on the same fetch and that object represents our fetch.
If you’re curious about that MicroContext, that goes back to being multi-tenant.
Since the fetch may happen on a background thread, we need to know what it was for.
Which site? Which database? What was the previous cache value?
Those are things we put on the context before passing it to the background thread for the lookup to grab a new value.
Passing the old value also lets us handle an error case as desired, e.g. logging the error and still returning the old value, because giving a user slightly out-of-date data is always always better than an error page.
We choose per call here though.
If returning the old value is bad for some reason – just don’t do that.
Types and Things
A question I often get is how do we use DTOs (data transfer objects)?
In short, we don’t.
We only use additional types and allocations when we need to.
For example, if we can run a .Query<MyType>("Select..."); from Dapper and stick it into cache, we will.
There’s little reason to create another type just to cache.
If it makes sense to cache the type that’s 1:1 with a database table (e.g. Post for the Posts table, or User for the Users table), we’ll cache that.
If there’s some subtype or combination of things that are the columns from a combined query, we’ll just .Query<T> as that type, populating from those columns, and cache that.
If that still sounds abstract, here’s a more concrete example:
[ProtoContract]
public class UserCounts
{
    [ProtoMember(1)] public int UserId { get; }
    [ProtoMember(2)] public int PostCount { get; }
    [ProtoMember(3)] public int CommentCount { get; }
}

public Dictionary<int, UserCounts> GetUserCounts() =>
    Current.SiteCache.GetSet<Dictionary<int, UserCounts>>("All-User-Counts", (old, ctx) =>
    {
        try
        {
            return ctx.DB.Query<UserCounts>(@"
  Select u.Id UserId, PostCount, CommentCount
    From Users u
         Cross Apply (Select Count(*) PostCount From Posts p Where u.Id = p.OwnerUserId) p
         Cross Apply (Select Count(*) CommentCount From PostComments pc Where u.Id = pc.UserId) pc")
                .ToDictionary(r => r.UserId);
        }
        catch(Exception ex)
        {
            Env.LogException(ex);
            return old; // Return the old value
        }
    }, 60, 5*60);
In this example we are taking advantage of Dapper’s built-in column mapping.
(Note that it sets get-only properties.)
The type used is just for this.
For example, it could even be private, and make this method take a int userId with the Dictionary<int, UserCount> being a method-internal detail.
We’re also showing how T old and the MicroContext are used here.
If an error occurs, we log it and return the previous value.
So…types. Yeah. We do whatever works. Our philosophy is to not create a lot of types unless they’re useful. DTOs generally don’t come with just the type, but also include a lot of mapping code – or more magical code (e.g. reflection) that maps across and is subject to unintentional breaks down the line. Keep. It. Simple. That’s all we’re doing here. Simple also means fewer allocations and instantiations. Performance is often the byproduct of simplicity.
Redis: The Good Types
Redis has a variety of data types.
All of the key/value examples thus far use “String” type in Redis.
But don’t think of this as a string data type like you’re used to in programming (for example, string in .NET, or in Java).
It basically means “some bytes” in the Redis usage.
It could be a string, it could be a binary image, or it could be…well, anything you can store in some bytes!
But, we use most of the other data types in various ways as well:
- Redis Lists are useful for queues like our aggregator or account actions to execute in-order.
- Redis Sets are useful for unique lists of items like “which account IDs are in this alpha test?” (things that are unique, but not ordered).
- Redis Hashes are useful for things that are dictionary-like, such as “What’s the latest activity date for a site?” (where the hash key ID is site and the value is a date). We use this to determine “Do we need to run badges on site X this time?” and other questions.
- Redis Sorted Sets are useful for ordered things like storing the slowest 100 MiniProfiler traces per route.
Speaking of sorted sets, we need to replace the /users page to be backed by sorted sets (one per reputation time range) with range queries instead.
Marc and I planned how to do this at a company meetup in Denver many years ago but keep forgetting to do it…
Monitoring Cache Performance
There are a few things to keep an eye on here. Remember those latency factors above? It’s super slow to go off box. When we’re rendering question pages in an average of 18–20ms, taking ~0.5ms for a Redis call is a lot. A few calls quickly add up to a significant part of our rendering time.
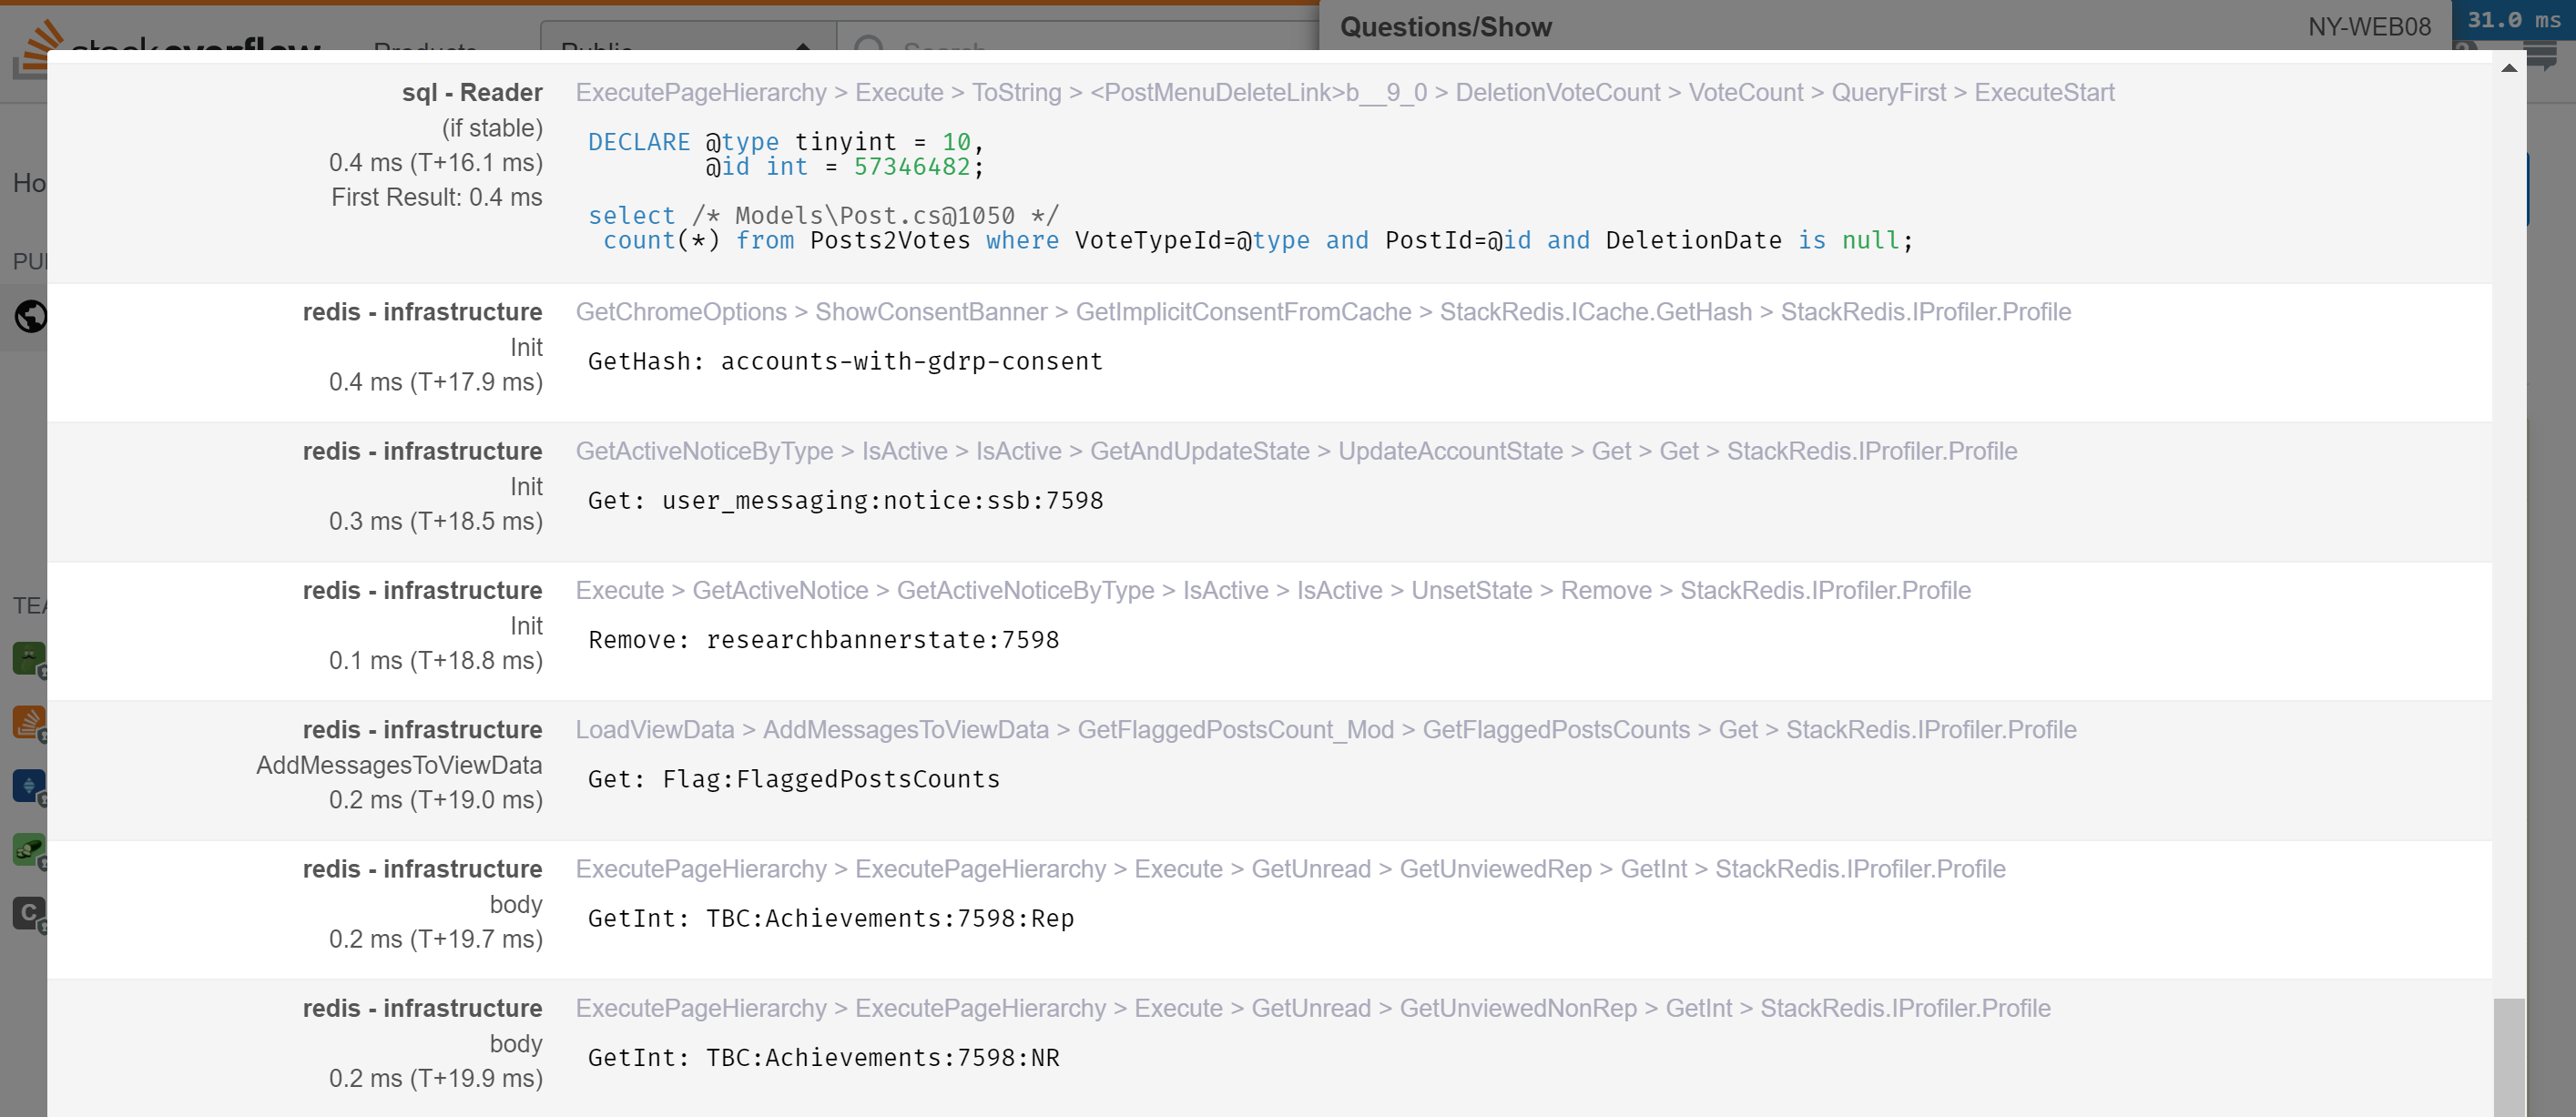
First, we’ll want to keep an eye on this at the page level. For this, we use MiniProfiler to see every Redis call involved in a page load. It’s hooked up with StackExchange.Redis’s profiling API. Here’s an example of what that looks like on a question page, getting my live across-the-network counts for the top bar:
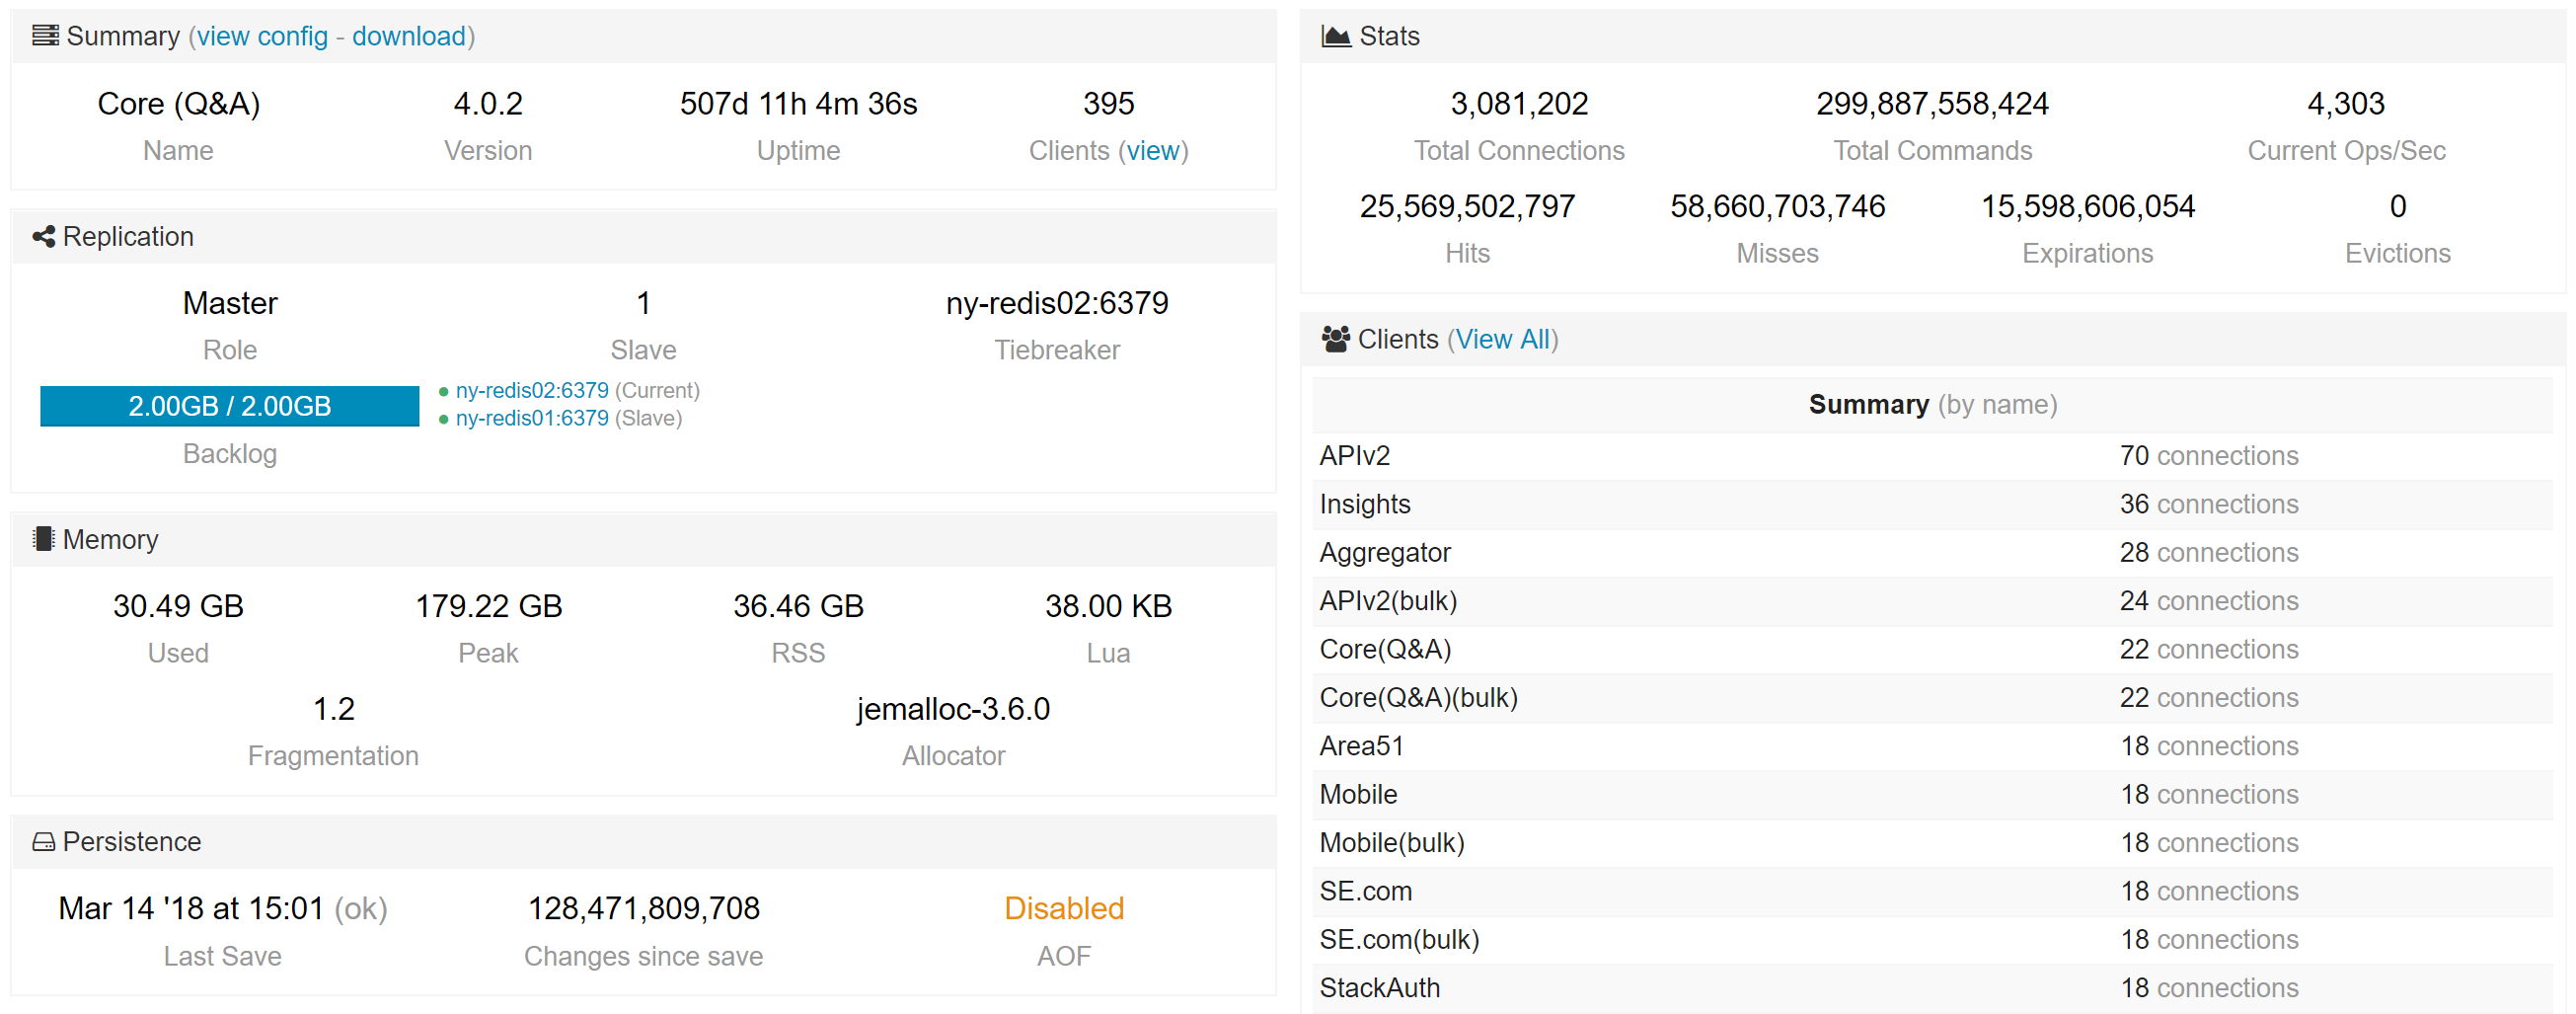
Second, we want to keep an eye on the Redis instances. For that, we use Opserver. Here’s what a single instance looks like:
We have some built-in tools there to analyze key usage and the ability to group them by regex pattern. This lets us combine what we know (we’re the ones caching!) with the data to see what’s eating the most space.
Note: Running such an analysis should only be done on a secondary. It’s very abusive on a master at scale. Opserver will by default run such analysis on a replica and block running it on a master without an override.
What’s Next?
.NET Core is well underway here at Stack.
We’ve ported most support services and are working on the main applications now.
There’s honestly not a lot of cache to the caching layer, but one interesting possibility is Utf8String (which hasn’t landed yet).
We cache a lot of stuff in total, lots of tiny strings in various places – things like “Related Questions” in the sidebar.
If those cache entries were UTF8 instead of the .NET default of UTF16, they’d be half the size.
When you’re dealing with hundreds of thousands of strings at any given time, it adds up.
Story Time
I asked what people wanted to know about caching on Twitter and how failures happen came up a lot. For fun, let’s recall a few that stand out in my mind:
Taking Redis Down While Trying to Save It
At one point, our Redis primary cache was getting to be about 70GB total. This was on 96GB servers. When we saw the growth over time, we planned a server upgrade and transition. By the time we got hardware in place and were ready to failover to a new master server, we had reached about 90GB of cache usage. Phew, close. But we made it!
…or not. I was travelling for this one, but helped planned it all out.
What we didn’t account for was the memory fork that happens for a BGSAVE in Redis (at least in that version – this was back in 2.x).
We were all very relieved to have made preparations in time, so on a weekend we hit the button and fired up data replication to the new server to prepare a failover to it.
And all of our websites promptly went offline.
What happens in the memory fork is that data that’s changed during the migration gets shadow copied, something that isn’t released until the clone finishes…because we need the state the server was at to initialize along with all changes since then to replicate to the new node (else we lose those new changes). So the rate at which new changes rack up is your memory growth during a copy. That 6GB went fast. Really fast. Then Redis crashed, the web servers went without Redis (something they hadn’t done in years), and they really didn’t handle it well.
So I pulled over on the side of the road, hopped on our team call, and we got the sites back up…against the new server and an empty cache. It’s important to note that Redis didn’t do anything wrong, we did. And Redis has been rock solid for a decade here. It’s one of the most stable pieces of infrastructure we have…you just don’t think about it.
But anyway, another lesson learned.
Accidentally Not Using Local Cache
A certain developer we have here will be reading this and cursing my name, but I love you guys and gals so let’s share anyway!
When we get a cache value back from Redis in our local/remote 2-layer cache story, we actually send two commands: a fetch of the key and a TTL.
The result of the TTL tells us how many seconds Redis is caching it for…that’s how long we also cache it in local server memory.
We used to use a -1 sentinel value for TTL through some library code to indicate something didn’t have a TTL.
The semantics changed in a refactor to null for “no TTL”…and we got some boolean logic wrong. Oops.
A rather simple statement like this from our Get<T> mentioned earlier:
if (ttl != -1) // ... push into L1
Became:
if (ttl == null) // ... push into L1
But most of our caches DO have a TTL. This meant the vast majority of keys (probably something like 95% or more) were no longer caching in L1 (local server memory). Every single call to any of these keys was going to Redis and back. Redis was so resilient and fast, we didn’t notice for a few hours. The actual logic was then corrected to:
if (ttl != null) // ... push into L1
…and everyone lived happily ever after.
Accidentally Caching Pages For .000006 Seconds
You read that right.
Back in 2011, we found a bit of code in our page-level output caching when looking into something unrelated:
.Duration = new TimeSpan(60);
This was intended to cache a thing for a minute.
Which would have worked great if the default constructor for TimeSpan was seconds and not ticks.
But! We were excited to find this.
How could cache be broken?
But hey, good news – wow we’re going to get such a performance boost by fixing this!
Nope. Not even a little. All we saw was memory usage increase a tiny bit. CPU usage also went up.
For fun: this was included at the end of in an interview back at MIX 2011 with Scott Hanselman. Wow. We looked so much younger then. Anyway, that leads us to…
Doing More Harm Than Good
For many years, we used to output cache major pages. This included the homepage, question list pages, question pages themselves, and RSS feeds.
Remember earlier: when you cache, you need to vary the cache keys based on the variants of cache. Concretely, this means: anonymous, or not? mobile, or not? deflate, gzip, or no compression? Realistically, we can’t (or shouldn’t) ever output cache for logged-in users. Your stats are in the top bar and it’s per-user. You’d notice your rep was inconsistent between page views and such.
Anyway, when you step back and combine these variants with the fact that about 80% of all questions are visited every two weeks, you realize that the cache hit rate is low. Really low. But the cost of memory to store those strings (most large enough to go directly on the large object heap) is very non-trivial. And the cost of the garbage collector cleaning them up is also non-trivial.
It turns out those two pieces of the equation are so non-trivial that caching did far more harm than good. The savings we got from the relatively occasional cache hit were drastically outweighed by the cost of having and cleaning up the cache. This puzzled us a bit at first, but when you zoom out and look at the numbers, it makes perfect sense.
For the past several years, Stack Overflow (and all Q&A sites) output cache nothing. Output caching is also not present in ASP.NET Core, so phew on not using it.
Full disclosure: we still cache full XML response strings (similar to, but not using output cache) specifically on some RSS feed routes. We do so because the hit rate is quite high on these routes. This specific cache has all of the downsides mentioned above, except it’s well worth it on the hit ratios.
Figuring Out That The World Is Crazier Than You Are
When .NET 4.6.0 came out, we found a bug. I was digging into why MiniProfiler didn’t show up on the first page load locally, slowly went insane, and then grabbed Marc Gravell to go descend into madness with me.
The bug happened in our cache layer due to the nature of the issue and how it specifically affected only tail calls. You can read about how it manifested here, but the general problem is: methods weren’t called with the parameters you passed in. Ouch. This resulted in random cache durations for us and was pretty scary when you think about it. Luckily the problem with the RyuJIT was hotfixed the following month.
.NET 4.6.2 Caching Responses for 2,017 years
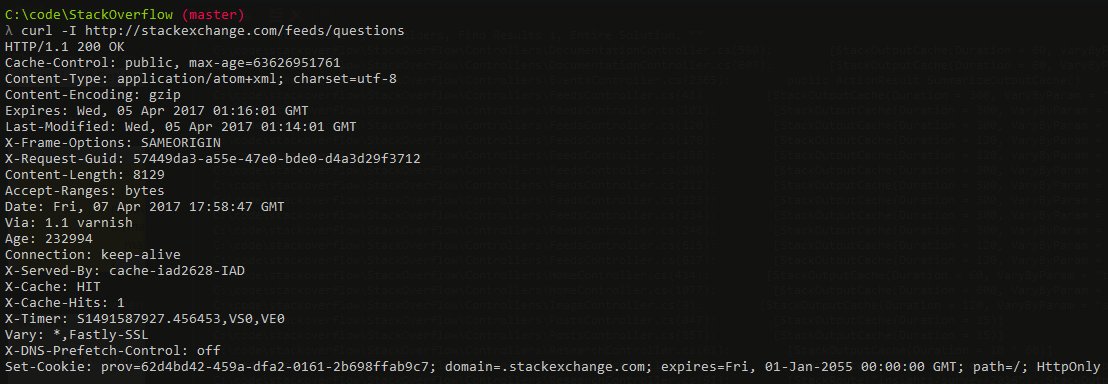
Okay this one isn’t server-side caching at all, but I’m throwing it in because it was super “fun”. Shortly after deploying .NET 4.6.2, we noticed some oddities with client cache behavior, CDN caches growing, and other crazy. It turns out, there was a bug in .NET 4.6.2.
The cause was simple enough: when comparing the DateTime values of “now” vs. when a response cache should expire and calculating the difference between those to figure out the max-age portion of the Cache-Control header, the value was subtly reset to 0 on the “now” side.
So let’s say:
2017-04-05 01:17:01 (cache until) - 2017-04-05 01:16:01 (now) = 60 seconds
Now, let’s say that “now” value was instead 0001-01-01 00:00:00…
2017-04-05 01:17:01 (cache until) - 0001-01-01 00:00:00 (now) = 63,626,951,821 seconds
Luckily the math is super easy. We’re telling a browser to cache that value for 2017 years, 4 months, 5 days, 1 hour, 17 minutes and 1 second. Which might be a tad bit of overkill. Or on CDNs, we’re telling CDNs to cache things for that long…also problematic.
Well crap. We didn’t realize this early enough. (Would you have checked for this? Are we idiots?) So that was in production and a rollback was not a quick solution. So what do we do?
Luckily, we had moved to Fastly at this point, which uses Varnish & VCL.
So we can just hop in there and detect these crazy max-age values and override them to something sane.
Unless, of course, you screw that up.
Yep.
Turns out on first push we missed a critical piece of the normal hash algorithm for cache keys on Fastly and did things like render people’s flair back when you tried to load a question.
This was corrected in a few minutes, but still: oops.
Sorry about that.
I reviewed and okayed that code to go out personally.
When It’s Sorta Redis But Not
One issue we had was the host itself interrupting Redis and having perceptible pipeline timeouts. We looked in Redis: the slowness was random. The commands doing it didn’t form any pattern or make any sense (e.g. tiny keys). We looked at the network and packet traces from both the client and server looked clean – the pause was inside the Redis host based on the correlated timings.
Okay so…what is it? Turns out after a lot of manual profiling and troubleshooting, we found another process on the host that spiked at the same time. It was a small spike we thought nothing of at first, but how it spiked was important.
It turns out that a monitoring process (dammit!) was kicking off vmstat to get memory statistics.
Not that often, not that abusive – it was actually pretty reasonable.
But what vmstat did was punt Redis off of the CPU core it was running on.
Like a jerk.
Sometimes. Randomly.
Which Redis instance? Well, that depends on the order they started in.
So yeah…this bug seemed to hop around.
The changing of context to another core was enough to see timeouts with how often we were hitting Redis with a constant pipe.
Once we found this and factored in that we have plenty of cores in these boxes, we began pinning Redis to specific cores on the physical hosts. This ensures the primary function of the servers always has priority and monitoring is secondary.
Since writing this and asking for reviews, I learned that Redis now has built-in latency monitoring which was added shortly after the earlier 2.8 version we were using at the time. Check out LATENCY DOCTOR especially.
AWESOME.
Thank you Salvatore Sanfilippo! He’s the lovely @antirez, author of Redis.
Now I need to go put the LATENCY bits into StackExchange.Redis and Opserver…
Caching FAQ
I also often get a lot of questions that don’t really fit so well above, but I wanted to cover them for the curious. And since you know we love Q&A up in here, let’s try a new section in these posts that I can easily add to as new questions come up.
Q: Why don’t you use Redis Cluster?
A: There are a few reasons here:
- We use databases, which aren’t a feature in Cluster (to minimize the message replication header size). We can get around this by moving the database ID into the cache key instead (as we do with local cache above). But, one giant database has maintainability trade-offs, like when you go to figure out which keys are using so much room.
- The replication topology thus far has been node to node, meaning maintenance on the master cluster would require shifting the same topology on a secondary cluster in our DR data center. This would make maintenance harder instead of easier. We’re waiting for cluster <-> cluster replication, rather than node <-> node replication there.
- It would require 3+ nodes to run correctly (due to elections and such). We currently only run 2 physical Redis servers per data center. Just 1 server is way more performance than we need, and the second is a replica/backup.
Q: Why don’t you use Redis Sentinel?
A: We looked into this, but the overall management of it wasn’t any simpler than we had today.
The idea of connecting to an endpoint and being directed over is great, but the management is complicated enough that it’s not worth changing our current strategy given how incredibly stable Redis is.
One of the biggest issues with Sentinel is the writing of the current topology state into the same config file.
This makes it very unfriendly to anyone with managed configs. For example, we use Puppet here and the file changes would fight with it every run.
Q: How do you secure Stack Overflow for Teams cache?
A: We maintain an isolated network and separate Redis servers for private data.
Stack Overflow Enterprise customers each have their own isolated network and Redis instances as well.
Q: What if Redis goes down?!?1!eleven
A: First, there’s a backup in the data center.
But let’s assume that fails too!
Who doesn’t love a good apocalypse?
Without Redis at all, we’d limp a bit when restarting the apps.
The cold cache would hurt a bit, smack SQL Server around a little, but we’d get back up.
You’d want to build slowly if Redis was down (or just hold off on building in general in this scenario).
As for the data, we would lose very little.
We have treated Redis as optional for local development since before the days it was an infrastructure component at all, and it remains optional today.
This means it’s not the source of truth for anything.
All cache data it contains could be re-populated from whatever the source is.
That leaves us only with active queues.
The queues in Redis are account merge type actions (executed sub-second – so a short queue), the aggregator (tallying network events into our central database), and some analytics (it’s okay if we lose some A/B test data for a minute).
All of these are okay to have a gap on – it’d be minimal loses.
Q: Are there downsides to databases?
A: Yes, one that I’m aware of.
At a high limit, it can eventually impact performance by measurable amounts.
When Redis expires keys, it loops over databases to find and clear those keys – think of it as checking each “namespace”.
At a high count, it’s a bigger loop.
Since this runs every 100ms, that number being big can impact performance.
Q: Are you going to open source the “L1”/”L2” cache implementation?
A: We’ve always wanted to, but a few things have stood in the way:
- It’s very “us”. By that I mean it’s very multi-tenant focused and that’s probably not the best API surface for everyone. This means we really need to sit down and design that API. It’s a set of APIs we’d love to put into our StackExchange.Redis client directly or as another library that uses it.
- There has been an idea to have more core support (e.g. what we use the pub/sub mechanism for) in Redis server itself. That’s coming in Redis version 6, so we can do a lot less custom pub/sub and use more standard things other clients will understand there. The less we write for “just us” or “just our client”, the better it is for everyone.
- Time. I wish we all had more of it. It’s the most precious thing you have – never take it for granted.
Q: With pipelining, how do you handle large Redis payloads?
A: We have a separate connection called “bulky” for this.
It has higher timeouts and is much more rarely used.
That’s if it should go in Redis.
If a worth-of-caching item is large but not particularly expensive to fetch, we may not use Redis and simply use “Local Cache”, fetching it n times for n web servers.
Per-user features (since user sessions are sticky to web servers on Q&A) may fit this bill as well.
Q: What happens when someone runs KEYS on production?
A: Tasers, if they’ll let me.
Seriously though, since Redis 2.8.0 you should at least use SCAN which doesn’t block Redis for a full key dump – it does so in chunks and lets other commands go through.
KEYS can cause a production blockage in a hurry.
And by “can”, I mean 100% of the time at our scale.
Q: What happens when someone runs FLUSHALL on production?
A: It’s against policy to comment on future criminal investigations.
Redis 6 is adding ACLs though, which will limit the suspect pool.
Q: How do the police investigators figure out what happened in either of the above cases? Or any latency spike?
A: Redis has a nifty feature called SLOWLOG which (by default) logs every command over 10ms in duration.
You can adjust this, but everything should be very fast, so that default 10ms is a relative eternity and what we keep it at.
When you run SLOWLOG you can see the last n entries (configurable), the command, and the arguments.
Opserver will show these on the instance page, making it easy to find the offender.
But, it could be network latency or an unrelated CPU spike/theft on the host. (We pin the Redis instances using processor affinity to avoid this.)
Q: Do you use Azure Cache for Redis for Stack Overflow Enterprise?
A: Yes, but we may not long-term.
It takes a surprisingly long time to provision when creating one for test environments and such.
We’re talking dozens of minutes up to an hour here.
We’ll likely use containers later, which will help us control the version used across all deployment modes as well.
Q: Do you expect every dev to know all of this to make caching decisions?
A: Absolutely not.
I had to look up exact values in many places here.
My goal is that developers understand a little bit about the layer beneath and relative costs of things – or at least a rough idea of them.
That’s why I stress the orders of magnitude here.
Those are the units you should be considering for cost/benefit evaluations on where and how you choose to cache.
Most people do not run at hundreds of millions of hits a day where the cost multiplier is so high it’ll ruin your day and optimizations decisions are far less important/impactful.
Do what works for you. This is what works for us, with some context on “why?” in hopes that it helps you make your decisions.
Tools
I just wanted to provide a handy list of the tools mentioned in the article as well as a few other bits we use to help with caching:
- StackExchange.Redis - Our open source .NET Redis client library.
- Opserver - Our open source dashboard for monitoring, including Redis.
- MiniProfiler - Our open source .NET profiling tool, with which we view Redis commands issued on any page load.
- Dapper - Our open source object relational mapper for any ADO.NET data source.
- protobuf-net - Marc Gravell’s Protocol Buffers library for idiomatic .NET.
What’s next? The way this series works is I blog in order of what the community wants to know about most. I normally go by the Trello board to see what’s next, but we probably have a queue jumper coming up. We’re almost done porting Stack Overflow to .NET Core and we have a lot of stories and tips to share as well as tools we’ve built to make that migration easier. The next time you see a lot of words from me may be the next Trello board item, or it may be .NET Core. If you have questions that you want to see answered in such a post, please put them on the .NET Core card (open to the public) and I’ll be reviewing all of that when I start writing it. Stay tuned, and thanks for following along.