Stack Overflow: The Architecture - 2016 Edition
This is #1 in a very long series of posts on Stack Overflow’s architecture. Welcome. Previous post (#0): Stack Overflow: A Technical Deconstruction Next post (#2): Stack Overflow: The Hardware - 2016 Edition
To get an idea of what all of this stuff “does,” let me start off with an update on the average day at Stack Overflow. So you can compare to the previous numbers from November 2013, here’s a day of statistics from February 9th, 2016 with differences since November 12th, 2013:
- 209,420,973 (+61,336,090) HTTP requests to our load balancer
- 66,294,789 (+30,199,477) of those were page loads
- 1,240,266,346,053 (+406,273,363,426) bytes (1.24 TB) of HTTP traffic sent
- 569,449,470,023 (+282,874,825,991) bytes (569 GB) total received
- 3,084,303,599,266 (+1,958,311,041,954) bytes (3.08 TB) total sent
- 504,816,843 (+170,244,740) SQL Queries (from HTTP requests alone)
- 5,831,683,114 (+5,418,818,063) Redis hits
- 17,158,874 (not tracked in 2013) Elastic searches
- 3,661,134 (+57,716) Tag Engine requests
- 607,073,066 (+48,848,481) ms (168 hours) spent running SQL queries
- 10,396,073 (-88,950,843) ms (2.8 hours) spent on Redis hits
- 147,018,571 (+14,634,512) ms (40.8 hours) spent on Tag Engine requests
- 1,609,944,301 (-1,118,232,744) ms (447 hours) spent processing in ASP.Net
- 22.71 (-5.29) ms average (19.12 ms in ASP.Net) for 49,180,275 question page renders
- 11.80 (-53.2) ms average (8.81 ms in ASP.Net) for 6,370,076 home page renders
You may be wondering about the drastic ASP.Net reduction in processing time compared to 2013 (which was 757 hours) despite 61 million more requests a day. That’s due to both a hardware upgrade in early 2015 as well as a lot of performance tuning inside the applications themselves. Please don’t forget: performance is still a feature. If you’re curious about more hardware specifics than I’m about to provide—fear not. The next post will be an appendix with detailed hardware specs for all of the servers that run the sites (I’ll update this with a link when it’s live).
So what’s changed in the last 2 years? Besides replacing some servers and network gear, not much. Here’s a top-level list of hardware that runs the sites today (noting what’s different since 2013):
- 4 Microsoft SQL Servers (new hardware for 2 of them)
- 11 IIS Web Servers (new hardware)
- 2 Redis Servers (new hardware)
- 3 Tag Engine servers (new hardware for 2 of the 3)
- 3 Elasticsearch servers (same)
- 4 HAProxy Load Balancers (added 2 to support CloudFlare)
- 2 Networks (each a Nexus 5596 Core + 2232TM Fabric Extenders, upgraded to 10Gbps everywhere)
- 2 Fortinet 800C Firewalls (replaced Cisco 5525-X ASAs)
- 2 Cisco ASR-1001 Routers (replaced Cisco 3945 Routers)
- 2 Cisco ASR-1001-x Routers (new!)
What do we need to run Stack Overflow? That hasn’t changed much since 2013, but due to the optimizations and new hardware mentioned above, we’re down to needing only 1 web server. We have unintentionally tested this, successfully, a few times. To be clear: I’m saying it works. I’m not saying it’s a good idea. It’s fun though, every time.
Now that we have some baseline numbers for an idea of scale, let’s see how we make those fancy web pages. Since few systems exist in complete isolation (and ours is no exception), architecture decisions often make far less sense without a bigger picture of how those pieces fit into the whole. That’s the goal here, to cover the big picture. Many subsequent posts will do deep dives into specific areas. This will be a logistical overview with hardware highlights only; the next post will have the hardware details.
For those of you here to see what the hardware looks like these days, here are a few pictures I took of rack A (it has a matching sister rack B) during our February 2015 upgrade:
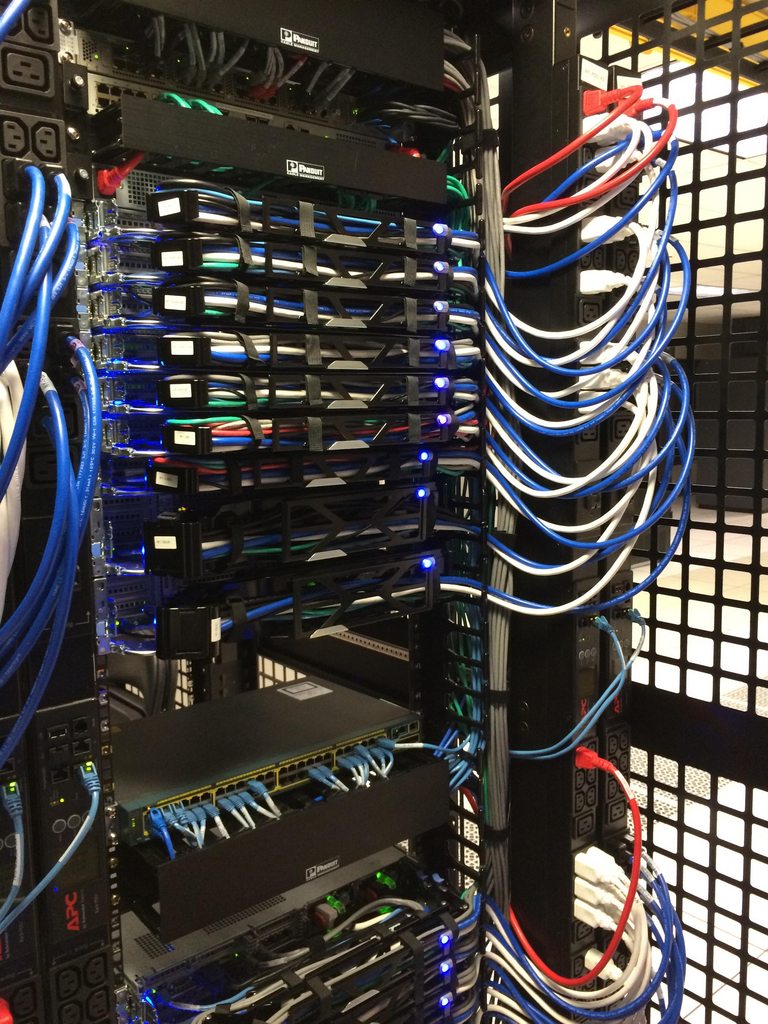
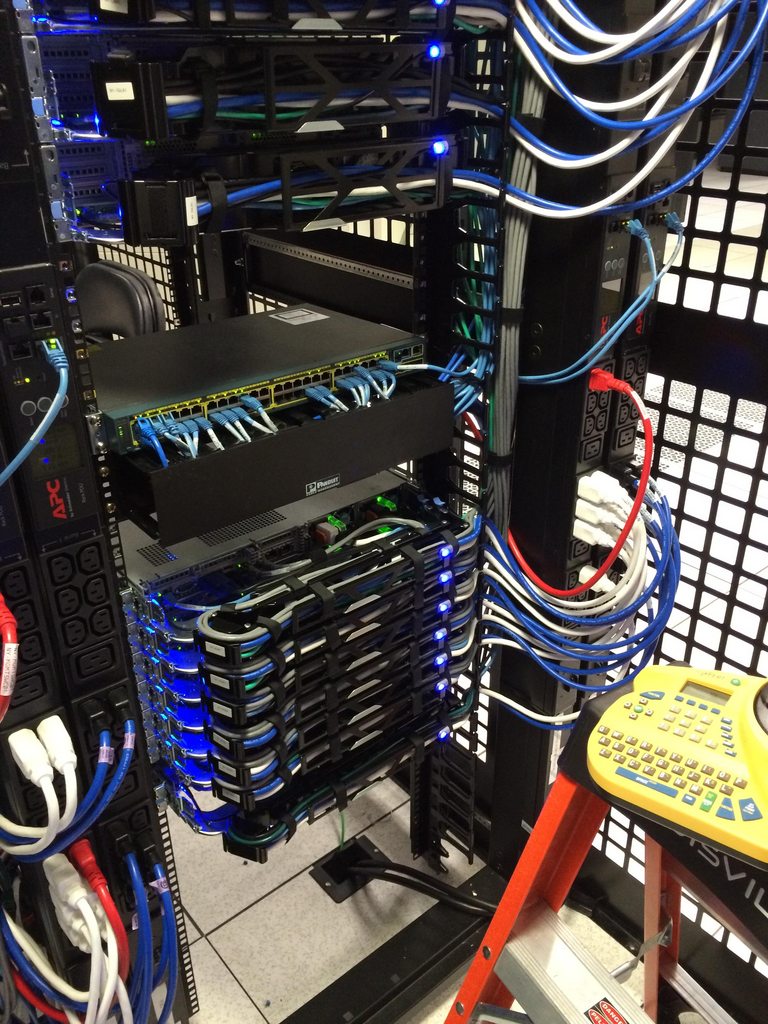
…and if you’re into that kind of thing, here’s the entire 256 image album from that week (you’re damn right that number’s intentional). Now, let’s dig into layout. Here’s a logical overview of the major systems in play:

Ground Rules
Here are some rules that apply globally so I don’t have to repeat them with every setup:
- Everything is redundant.
- All servers and network gear have at least 2x 10Gbps connectivity.
- All servers have 2 power feeds via 2 power supplies from 2 UPS units backed by 2 generators and 2 utility feeds.
- All servers have a redundant partner between rack A and B.
- All servers and services are doubly redundant via another data center (Colorado), though I’m mostly talking about New York here.
- Everything is redundant.
The Internets
First, you have to find us—that’s DNS. Finding us needs to be fast, so we farm this out to CloudFlare (currently) because they have DNS servers nearer to almost everyone around the world. We update our DNS records via an API and they do the “hosting” of DNS. But since we’re jerks with deeply-rooted trust issues, we still have our own DNS servers as well. Should the apocalypse happen (probably caused by the GPL, Punyon, or caching) and people still want to program to take their mind off of it, we’ll flip them on.
After you find our secret hideout, HTTP traffic comes from one of our four ISPs (Level 3, Zayo, Cogent, and Lightower in New York) and flows through one of our four edge routers. We peer with our ISPs using BGP (fairly standard) in order to control the flow of traffic and provide several avenues for traffic to reach us most efficiently. These ASR-1001 and ASR-1001-X routers are in 2 pairs, each servicing 2 ISPs in active/active fashion—so we’re redundant here. Though they’re all on the same physical 10Gbps network, external traffic is in separate isolated external VLANs which the load balancers are connected to as well. After flowing through the routers, you’re headed for a load balancer.
I suppose this may be a good time to mention we have a 10Gbps MPLS between our 2 data centers, but it is not directly involved in serving the sites. We use this for data replication and quick recovery in the cases where we need a burst. “But Nick, that’s not redundant!” Well, you’re technically correct (the best kind of correct), that’s a single point of failure on its face. But wait! We maintain 2 more failover OSPF routes (the MPLS is #1, these are #2 and 3 by cost) via our ISPs. Each of the sets mentioned earlier connects to the corresponding set in Colorado, and they load balance traffic between in the failover situation. We could make both sets connect to both sets and have 4 paths but, well, whatever. Moving on.
Load Balancers (HAProxy)
The load balancers are running HAProxy 1.5.15 on CentOS 7, our preferred flavor of Linux. TLS (SSL) traffic is also terminated in HAProxy. We’ll be looking hard at HAProxy 1.7 soon for HTTP/2 support.
Unlike all other servers with a dual 10Gbps LACP network link, each load balancer has 2 pairs of 10Gbps: one for the external network and one for the DMZ. These boxes run 64GB or more of memory to more efficiently handle SSL negotiation. When we can cache more TLS sessions in memory for reuse, there’s less to recompute on subsequent connections to the same client. This means we can resume sessions both faster and cheaper. Given that RAM is pretty cheap dollar-wise, it’s an easy choice.
The load balancers themselves are a pretty simple setup. We listen to different sites on various IPs (mostly for certificate concerns and DNS management) and route to various backends based mostly on the host header. The only things of note we do here is rate limiting and some header captures (sent from our web tier) into the HAProxy syslog message so we can record performance metrics for every single request. We’ll cover that later too.
Web Tier (IIS 8.5, ASP.Net MVC 5.2.3, and .Net 4.6.1)
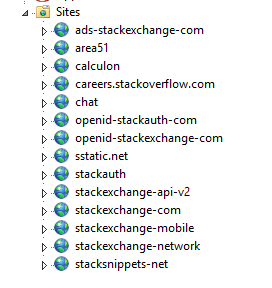
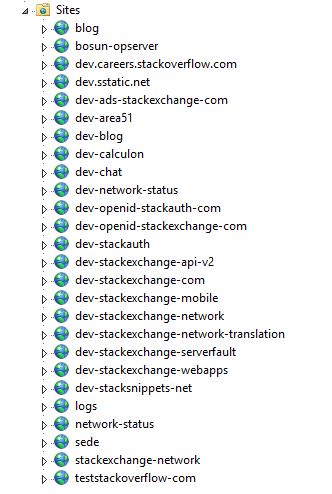
The load balancers feed traffic to 9 servers we refer to as “primary” (01-09) and 2 “dev/meta” (10-11, our staging environment) web servers. The primary servers run things like Stack Overflow, Careers, and all Stack Exchange sites except meta.stackoverflow.com and meta.stackexchange.com, which run on the last 2 servers. The primary Q&A Application itself is multi-tenant. This means that a single application serves the requests for all Q&A sites. Put another way: we can run the entire Q&A network off of a single application pool on a single server. Other applications like Careers, API v2, Mobile API, etc. are separate. Here’s what the primary and dev tiers look like in IIS:
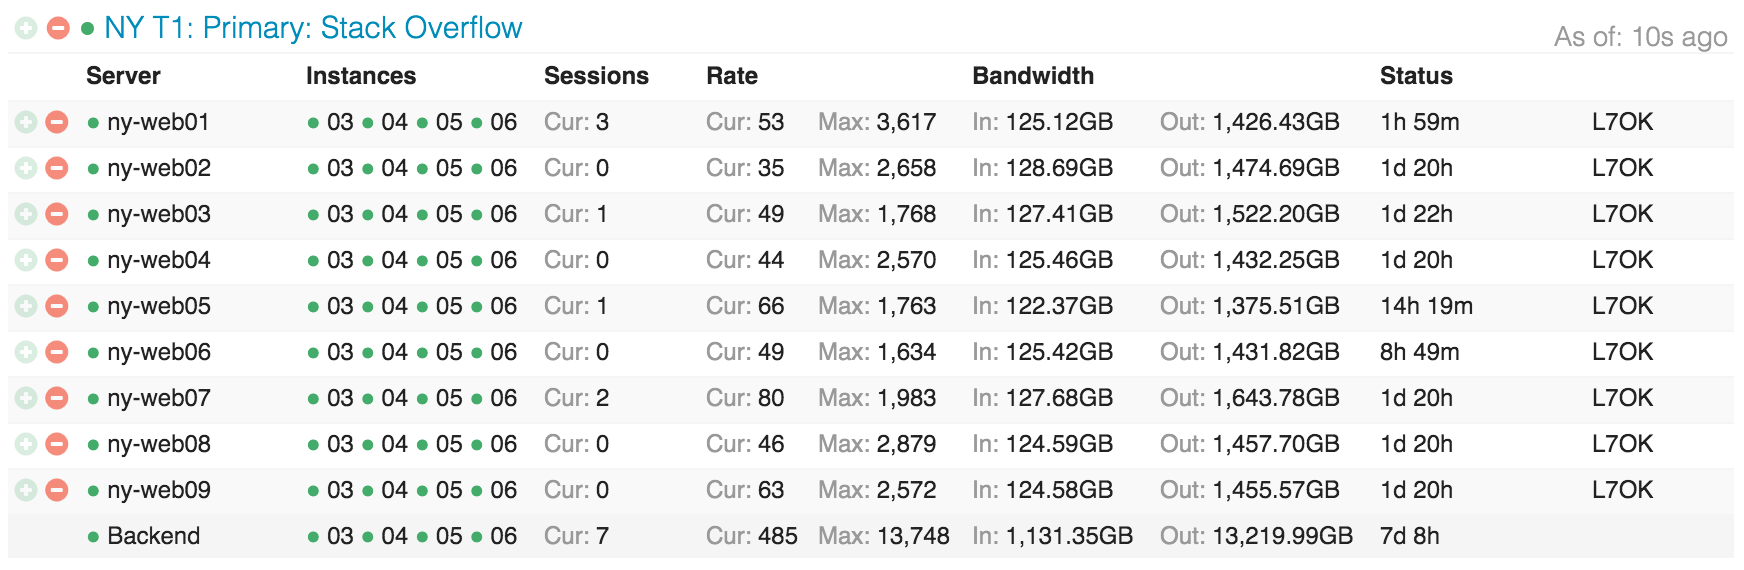
Here’s what Stack Overflow’s distribution across the web tier looks like in Opserver (our internal monitoring dashboard):
…and here’s what those web servers look like from a utilization perspective:
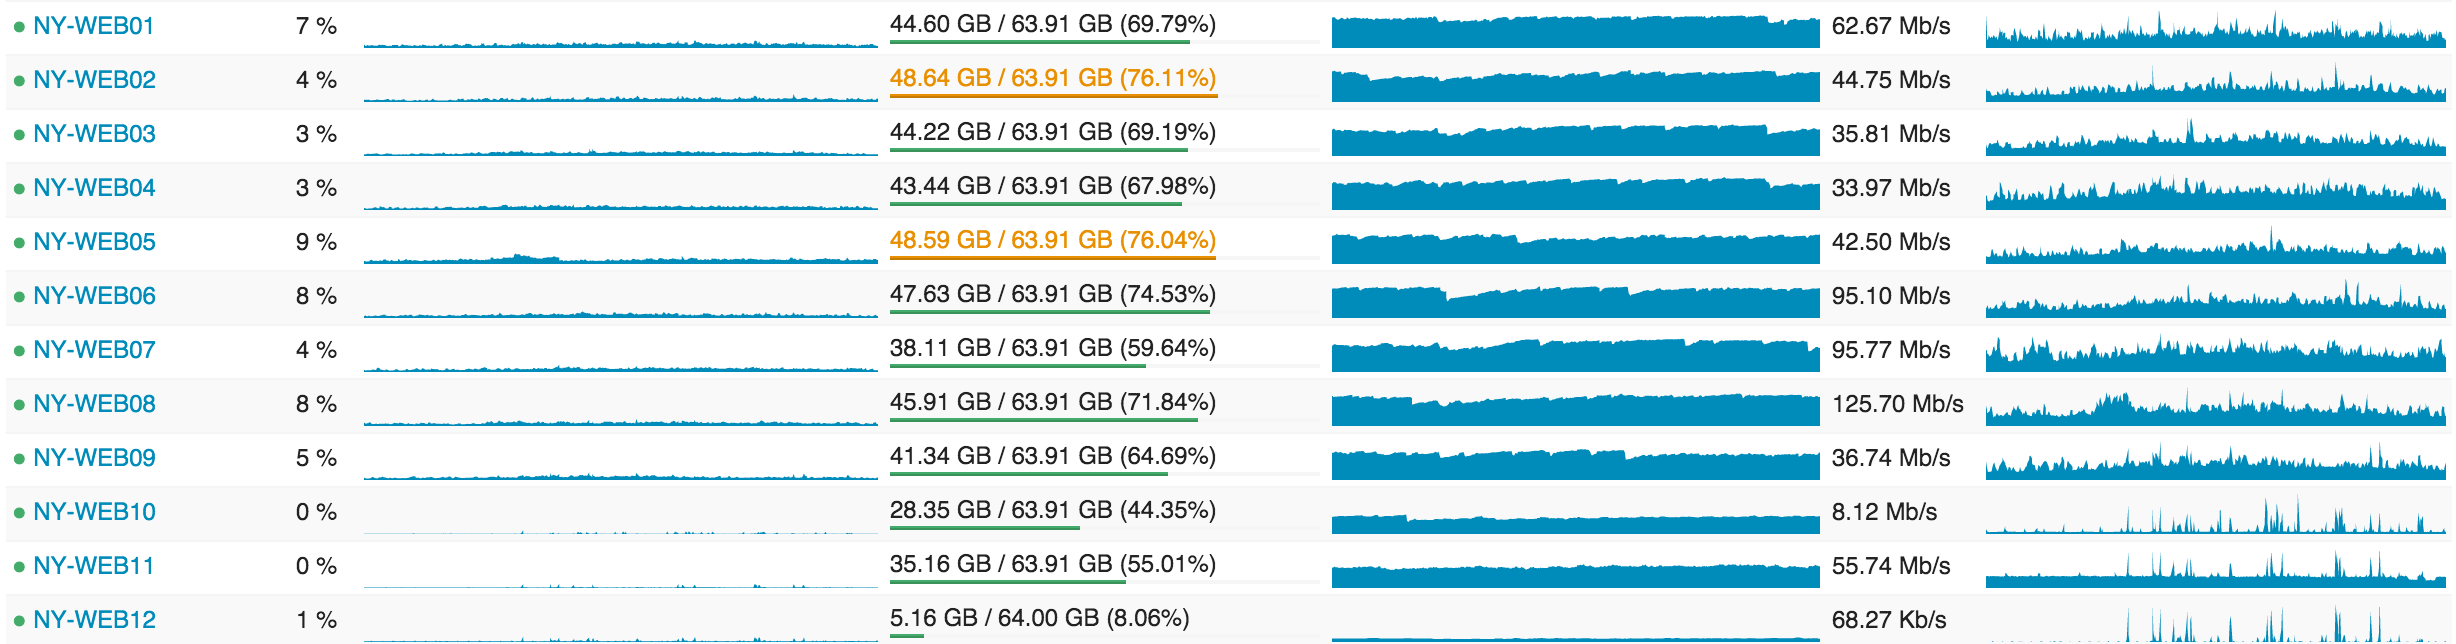
I’ll go into why we’re so overprovisioned in future posts, but the highlight items are: rolling builds, headroom, and redundancy.
Service Tier (IIS, ASP.Net MVC 5.2.3, .Net 4.6.1, and HTTP.SYS)
Behind those web servers is the very similar “service tier.” It’s also running IIS 8.5 on Windows 2012R2. This tier runs internal services to support the production web tier and other internal systems. The two big players here are “Stack Server” which runs the tag engine and is based on http.sys (not behind IIS) and the Providence API (IIS-based). Fun fact: I have to set affinity on each of these 2 processes to land on separate sockets because Stack Server just steamrolls the L2 and L3 cache when refreshing question lists on a 2-minute interval.
These service boxes do heavy lifting with the tag engine and backend APIs where we need redundancy, but not 9x redundancy. For example, loading all of the posts and their tags that change every n minutes from the database (currently 2) isn’t that cheap. We don’t want to do that load 9 times on the web tier; 3 times is enough and gives us enough safety. We also configure these boxes differently on the hardware side to be better optimized for the different computational load characteristics of the tag engine and elastic indexing jobs (which also run here). The “tag engine” is a relatively complicated topic in itself and will be a dedicated post. The basics are: when you visit /questions/tagged/java, you’re hitting the tag engine to see which questions match. It does all of our tag matching outside of /search, so the new navigation, etc. are all using this service for data.
Cache & Pub/Sub (Redis)
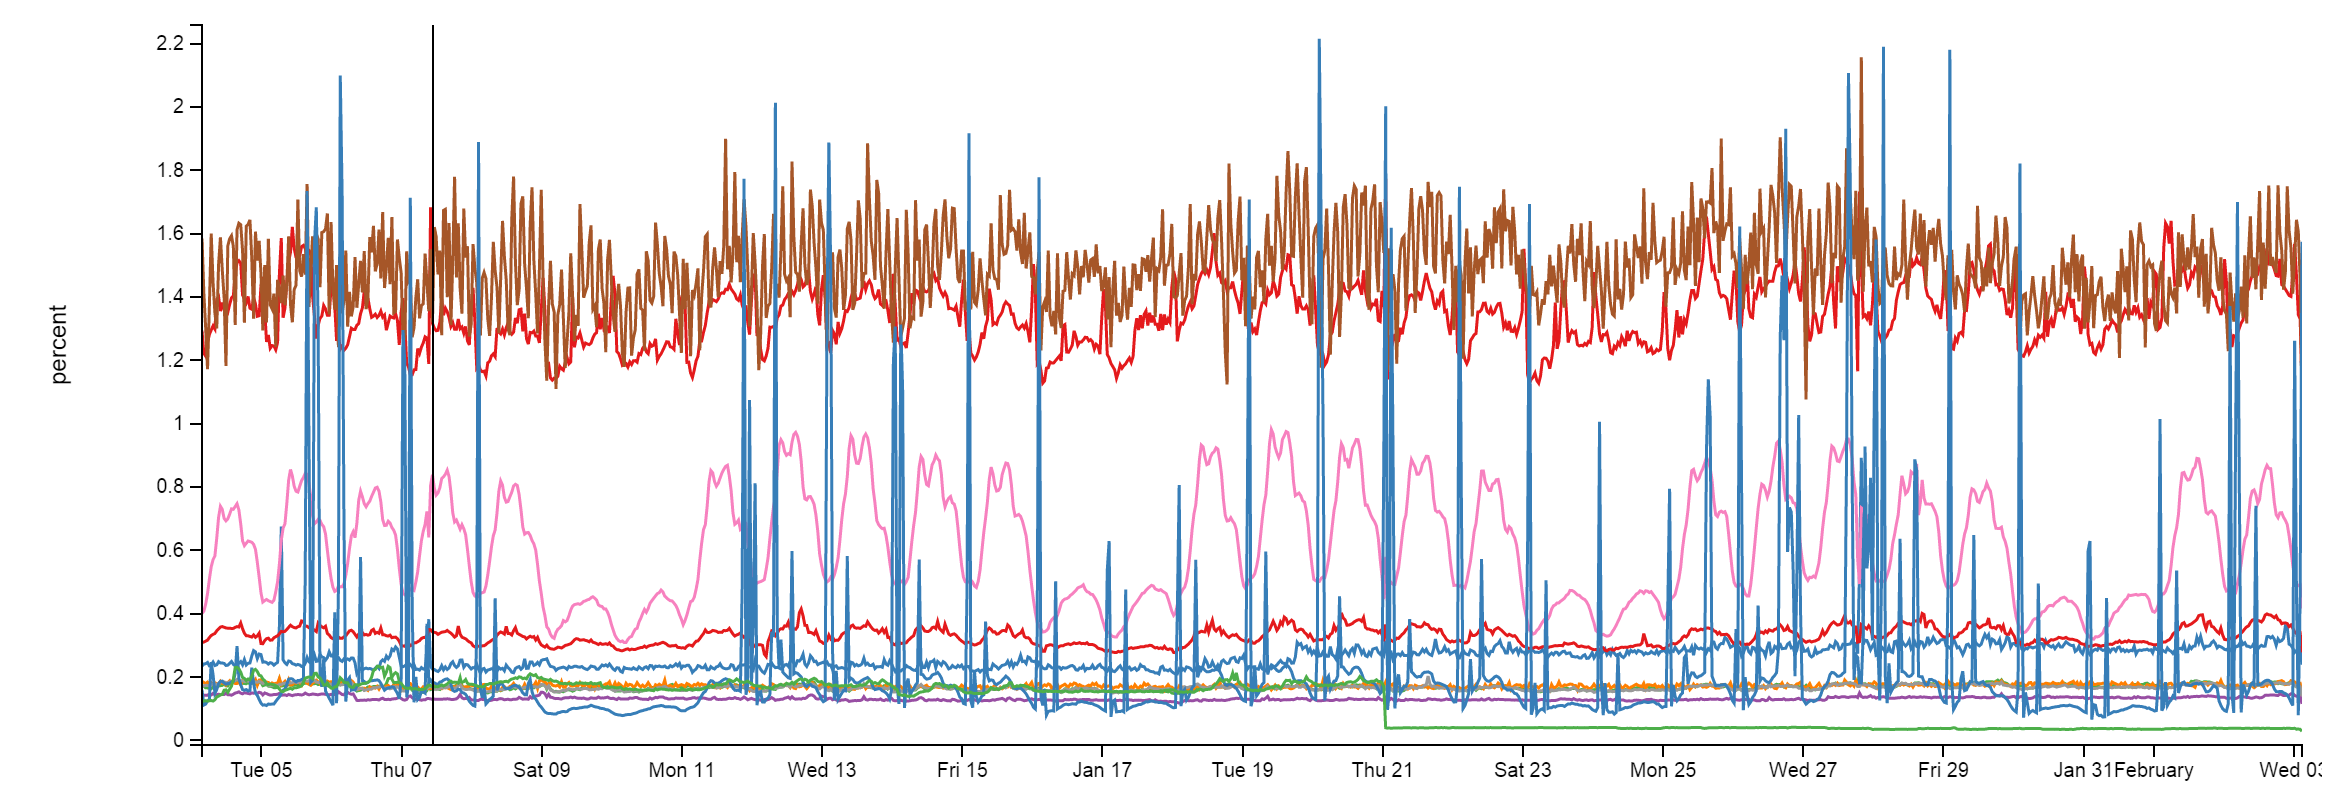
We use Redis for a few things here and it’s rock solid. Despite doing about 160 billion ops a month, every instance is below 2% CPU. Usually much lower:
We have an L1/L2 cache system with Redis. “L1” is HTTP Cache on the web servers or whatever application is in play. “L2” is falling back to Redis and fetching the value out. Our values are stored in the Protobuf format, via protobuf-dot-net by Marc Gravell. For a client, we’re using StackExchange.Redis—written in-house and open source. When one web server gets a cache miss in both L1 and L2, it fetches the value from source (a database query, API call, etc.) and puts the result in both local cache and Redis. The next server wanting the value may miss L1, but would find the value in L2/Redis, saving a database query or API call.
We also run many Q&A sites, so each site has its own L1/L2 caching: by key prefix in L1 and by database ID in L2/Redis. We’ll go deeper on this in a future post.
Alongside the 2 main Redis servers (master/slave) that run all the site instances, we also have a machine learning instance slaved across 2 more dedicated servers (due to memory). This is used for recommending questions on the home page, better matching to jobs, etc. It’s a platform called Providence, covered by Kevin Montrose here.
The main Redis servers have 256GB of RAM (about 90GB in use) and the Providence servers have 384GB of RAM (about 125GB in use).
Redis isn’t just for cache though, it also has a publish & subscriber mechanism where one server can publish a message and all other subscribers receive it—including downstream clients on Redis slaves. We use this mechanism to clear L1 caches on other servers when one web server does a removal for consistency, but there’s another great use: websockets.
Websockets (https://github.com/StackExchange/NetGain)
We use websockets to push real-time updates to users such as notifications in the top bar, vote counts, new nav counts, new answers and comments, and a few other bits.
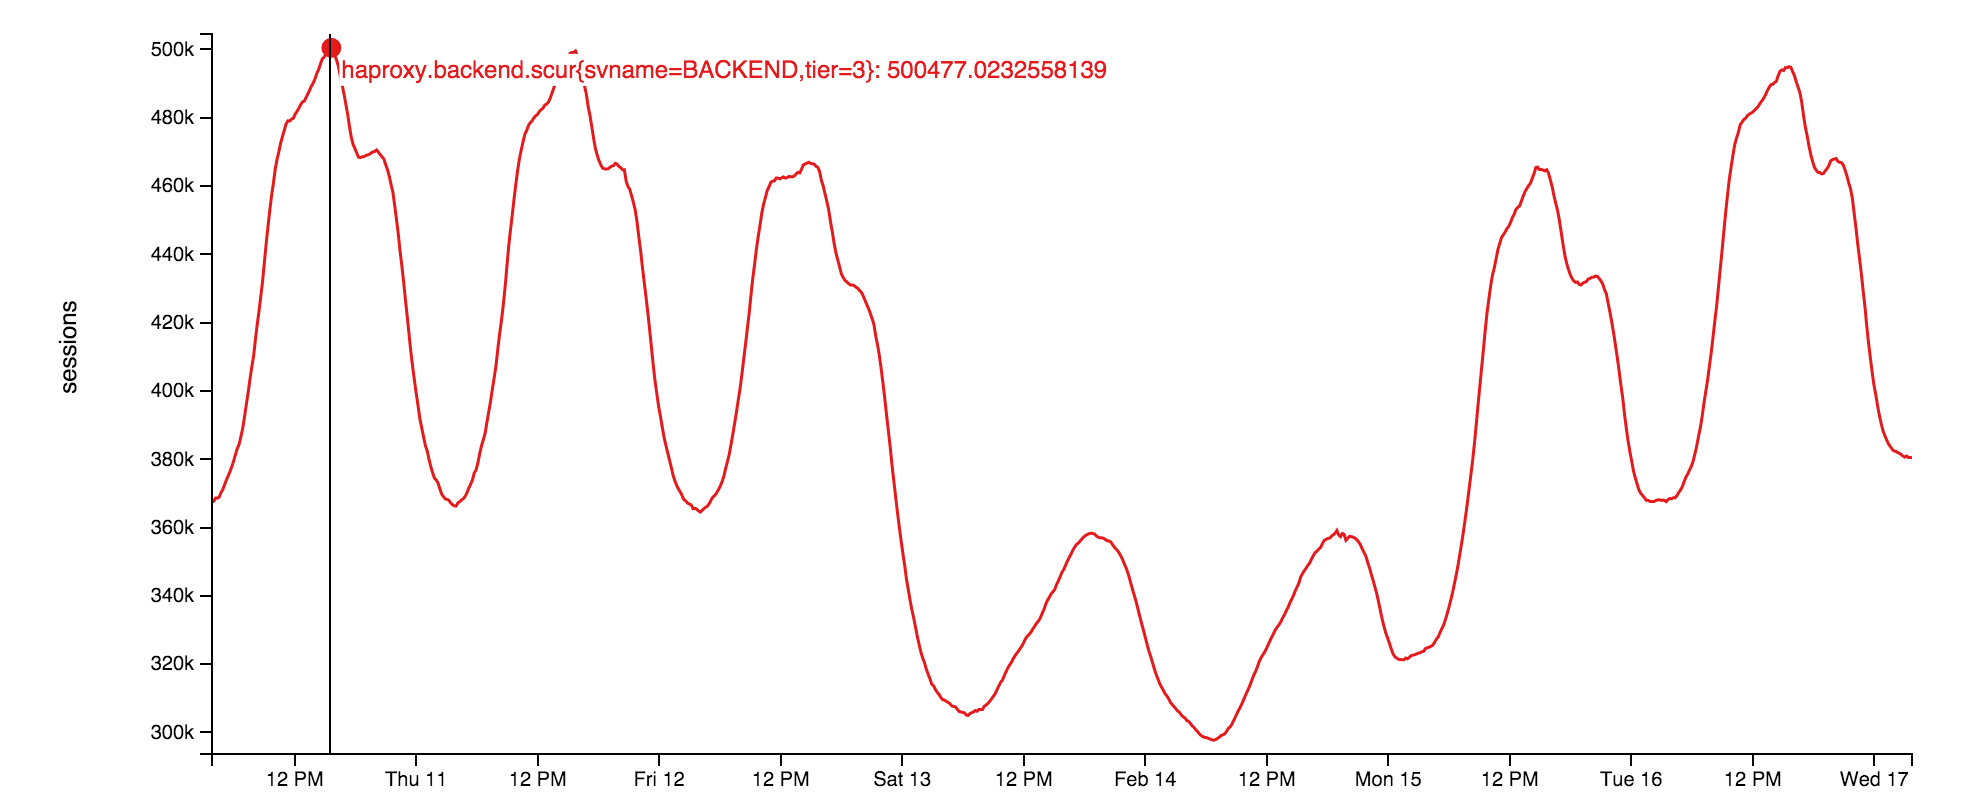
The socket servers themselves are using raw sockets running on the web tier. It’s a very thin application on top of our open source library: StackExchange.NetGain. During peak, we have about 500,000 concurrent websocket connections open. That’s a lot of browsers. Fun fact: some of those browsers have been open for over 18 months. We’re not sure why. Someone should go check if those developers are still alive. Here’s what this week’s concurrent websocket pattern looks like:
Why websockets? They’re tremendously more efficient than polling at our scale. We can simply push more data with fewer resources this way, while being more instant to the user. They’re not without issues though—ephemeral port and file handle exhaustion on the load balancer are fun issues we’ll cover later.
Search (Elasticsearch)
Spoiler: there’s not a lot to get excited about here. The web tier is doing pretty vanilla searches against Elasticsearch 1.4, using the very slim high-performance StackExchange.Elastic client. Unlike most things, we have no plans to open source this simply because it only exposes a very slim subset of the API we use. I strongly believe releasing it would do more harm than good with developer confusion. We’re using elastic for /search, calculating related questions, and suggestions when asking a question.
Each Elastic cluster (there’s one in each data center) has 3 nodes, and each site has its own index. Careers has an additional few indexes. What makes our setup a little non-standard in the elastic world: our 3 server clusters are a bit beefier than average with all SSD storage, 192GB of RAM, and dual 10Gbps network each.
The same application domains (yeah, we’re screwed with .Net Core here…) in Stack Server that host the tag engine also continually index items in Elasticsearch. We do some simple tricks here such as ROWVERSION in SQL Server (the data source) compared against a “last position” document in Elastic. Since it behaves like a sequence, we can simply grab and index any items that have changed since the last pass.
The main reason we’re on Elasticsearch instead of something like SQL full-text search is scalability and better allocation of money. SQL CPUs are comparatively very expensive, Elastic is cheap and has far more features these days. Why not Solr? We want to search across the entire network (many indexes at once), and this wasn’t supported at decision time. The reason we’re not on 2.x yet is a major change to “types” means we need to reindex everything to upgrade. I just don’t have enough time to make the needed changes and migration plan yet.
Databases (SQL Server)
We’re using SQL Server as our single source of truth. All data in Elastic and Redis comes from SQL Server. We run 2 SQL Server clusters with AlwaysOn Availability Groups. Each of these clusters has 1 master (taking almost all of the load) and 1 replica in New York. Additionally, they have 1 replica in Colorado (our DR data center). All replicas are asynchronous.
The first cluster is a set of Dell R720xd servers, each with 384GB of RAM, 4TB of PCIe SSD space, and 2x 12 cores. It hosts the Stack Overflow, Sites (bad name, I’ll explain later), PRIZM, and Mobile databases.
The second cluster is a set of Dell R730xd servers, each with 768GB of RAM, 6TB of PCIe SSD space, and 2x 8 cores. This cluster runs everything else. That list includes Talent, Open ID, Chat, our Exception log, and every other Q&A site (e.g. Super User, Server Fault, etc.).
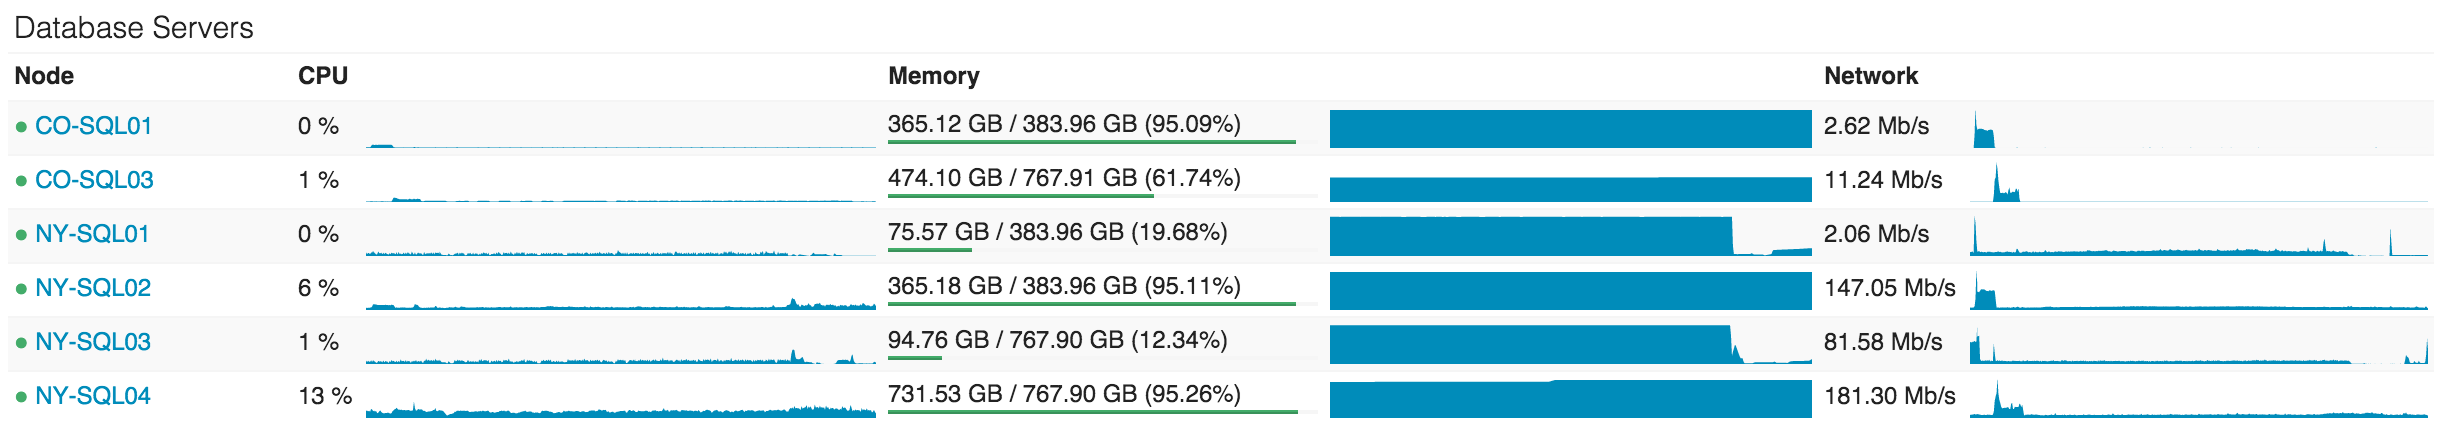
CPU utilization on the database tier is something we like to keep very low, but it’s actually a little high at the moment due to some plan cache issues we’re addressing. As of right now, NY-SQL02 and 04 are masters, 01 and 03 are replicas we just restarted today during some SSD upgrades. Here’s what the past 24 hours looks like:
Our usage of SQL is pretty simple. Simple is fast. Though some queries can be crazy, our interaction with SQL itself is fairly vanilla. We have some legacy Linq2Sql, but all new development is using Dapper, our open source Micro-ORM using POCOs. Let me put this another way: Stack Overflow has only 1 stored procedure in the database and I intend to move that last vestige into code.
Libraries
Okay, let’s change gears to something that can more directly help you. I’ve mentioned a few of these up above, but I’ll provide a list here of many open-source .Net libraries we maintain for the world to use. We open sourced them because they have no core business value but can help the world of developers. I hope you find these useful today:
- Dapper (.Net Core) - High-performance Micro-ORM for ADO.Net
- StackExchange.Redis - High-performance Redis client
- MiniProfiler - Lightweight profiler we run on every page (also supports Ruby, Go, and Node)
- Exceptional - Error logger for SQL, JSON, MySQL, etc.
- Jil - High-performance JSON (de)serializer
- Sigil - A .Net CIL generation helper (for when C# isn’t fast enough)
- NetGain - High-performance websocket server
- Opserver - Monitoring dashboard polling most systems directly and feeding from Orion, Bosun, or WMI as well.
- Bosun - Backend monitoring system, written in Go
Next up is a detailed current hardware list of what runs our code. After that, we go down the list. Stay tuned.