Stack Overflow: How We Do Monitoring - 2018 Edition
This is #4 in a very long series of posts on Stack Overflow’s architecture.
Previous post (#3): Stack Overflow: How We Do Deployment - 2016 Edition
What is monitoring? As far as I can tell, it means different things to different people. But we more or less agree on the concept. I think. Maybe. Let’s find out! When someone says monitoring, I think of:
…but evidently some people think of other things. Those people are obviously wrong, but let’s continue. When I’m not a walking zombie after reading a 10,000 word blog post some idiot wrote, I see monitoring as the process of keeping an eye on your stuff, like a security guard sitting at a desk full of cameras somewhere. Sometimes they fall asleep–that’s monitoring going down. Sometimes they’re distracted with a doughnut delivery–that’s an upgrade outage. Sometimes the camera is on a loop–I don’t know where I was going with that one, but someone’s probably robbing you. And then you have the fire alarm. You don’t need a human to trigger that. The same applies when a door gets opened, maybe that’s wired to a siren. Or maybe it’s not. Or maybe the siren broke in 1984.
I know what you’re thinking: Nick, what the hell? My point is only that monitoring any application isn’t that much different from monitoring anything else. Some things you can automate. Some things you can’t. Some things have thresholds for which alarms are valid. Sometimes you’ll get those thresholds wrong (especially on holidays). And sometimes, when setting up further automation isn’t quite worth it, you just make using human eyes easier.
What I’ll discuss here is what we do. It’s not the same for everyone. What’s important and “worth it” will be different for almost everyone. As with everything else in life, it’s full of trade-off decisions. Below are the ones we’ve made so far. They’re not perfect. They are evolving. And when new data or priorities arise, we will change earlier decisions when it warrants doing so. That’s how brains are supposed to work.
And once again this post got longer and longer as I wrote it (but a lot of pictures make up that scroll bar!). So, links for your convenience:
- Types of Data
- Alerting
- Bosun
- Grafana
- Client Timings
- MiniProfiler
- Opserver
- Where Do We Go Next?
- Tools Summary
Types of Data
Monitoring generally consists of a few types of data (I’m absolutely arbitrarily making some groups here):
- Logs: Rich, detailed text and data but not awesome for alerting
- Metrics: Tagged numbers of data for telemetry–good for alerting, but lacking in detail
- Health Checks: Is it up? Is it down? Is it sideways? Very specific, often for alerting
- Profiling: Performance data from the application to see how long things are taking
- …and other complex combinations for specific use cases that don’t really fall into any one of these.
Logs
Let’s talk about logs. You can log almost anything!
- Info messages? Yep.
- Errors? Heck yeah!
- Traffic? Sure!
- Email? Careful, GDPR.
- Anything else? Well, I guess.
Sounds good. I can log whatever I want! What’s the catch? Well, it’s a trade-off. Have you ever run a program with tons of console output? Run the same program without it? Goes faster, doesn’t it? Logging has a few costs. First, you often need to allocate strings for the logging itself. That’s memory and garbage collection (for .NET and some other platforms). When you’re logging somewhere, that usually that means disk space. If we’re traversing a network (and to some degree locally), it also means bandwidth and latency.
…and I was just kidding about GDPR only being a concern for email…GDPR is a concern for all of the above. Keep retention and compliance in mind when logging anything. It’s another cost to consider.
Let’s say none of those are significant problems and we want to log all the things. Tempting, isn’t it? Well, then we can have too much of a good thing. What happens when you need to look at those logs? It’s more to dig through. It can make finding the problem much harder and slower. With all logging, it’s a balance of logging what you think you’ll need vs. what you end up needing. You’ll get it wrong. All the time. And you’ll find a newly added feature didn’t have the right logging when things went wrong. And you’ll finally figure that out (probably after it goes south)…and add that logging. That’s life. Improve and move on. Don’t dwell on it, just take the lesson and learn from it. You’ll think about it more in code reviews and such afterwards.
So what do we log? It depends on the system. For any systems we build, we always log errors. (Otherwise, why even throw them?). We do this with StackExchange.Exceptional, an open source .NET error logger I maintain. It logs to SQL Server. These are viewable in-app or via Opserver (which we’ll talk more about in a minute).
For systems like Redis, Elasticsearch, and SQL Server, we’re simply logging to local disk using their built-in mechanisms for logging and log rotation. For other SNMP-based systems like network gear, we forward all of that to our Logstash cluster which we have Kibana in front of for querying. A lot of the above is also queried at alert time by Bosun for details and trends, which we’ll dive into next.
Logs: HAProxy
We also log a minimal summary of public HTTP requests (only top level…no cookies, no form data, etc.) that go through HAProxy (our load balancer) because when someone can’t log in, an account gets merged, or any of a hundred other bug reports come in it’s immensely valuable to go see what flow led them to disaster. We do this in SQL Server via clustered columnstore indexes. For the record, Jarrod Dixon first suggested and started the HTTP logging about 8 years ago and we all told him he was an insane lunatic and it was a tremendous waste of resources. Please no one tell him he was totally right. A new per-month storage format will be coming soon, but that’s another story.
In those requests, we use profiling that we’ll talk about shortly and send headers to HAProxy with certain performance numbers. HAProxy captures and strips those headers into the syslog row we forward for processing into SQL. Those headers include:
- ASP.NET Overall Milliseconds (encompasses those below)
- SQL Count (queries) & Milliseconds
- Redis Count (hits) & Milliseconds
- HTTP Count (requests sent) & Milliseconds
- Tag Engine Count (queries) & Milliseconds
- Elasticsearch Count (hits) & Milliseconds
If something gets better or worse we can easily query and compare historical data.
It’s also useful in ways we never really thought about.
For example, we’ll see a request and the count of SQL queries run and it’ll tell us how far down a code path a user went.
Or when SQL connection pools pile up, we can look at all requests from a particular server at a particular time to see what caused that contention.
All we’re doing here is tracking a count of calls and time for n services.
It’s super simple, but also extremely effective.
The thing that listens for syslog and saves to SQL is called the Traffic Processing Service, because we planned for it to send reports one day.
Alongside those headers, the default HAProxy log row format has a few other timings per request:
- TR: Time a client took to send us the request (fairly useless when keepalive is in play)
- Tw: Time spent waiting in queues
- Tc: Time spent waiting to connect to the web server
- Tr: Time the web server took to fully render a response
As another example of simple but important, the delta between Tr and the AspNetDurationMs header (a timer started and ended on the very start and tail of a request) tells us how much time was spent in the OS, waiting for a thread in IIS, etc.
Health Checks
Health checks are things that check…well, health. “Is this healthy?” has four general answers:
- Yes: “ALL GOOD CAPTAIN!”
- No: “@#$%! We’re down!”
- Kinda: “Well, I guess we’re technically online…”
- Unknown: “No clue…they won’t answer the phone”
The conventions on these are generally green, red, yellow, and grey (or gray, whatever) respectively. Health checks have a few general usages. In any load distribution setup such as a cluster of servers working together or a load balancer in front of a group of servers, health checks are a way to see if a member is up to a role or task. For example in Elasticsearch if a node is down, it’ll rebalance shards and load across the other members…and do so again when the node returns to healthy. In a web tier, a load balancer will stop sending traffic to a down node and continue to balance it across the healthy ones.
For HAProxy, we use the built-in health checks with a caveat.
As of late 2018 when I’m writing this post, we’re in ASP.NET MVC5 and still working on our transition to .NET Core.
An important detail is that our error page is a redirect, for example /questions to /error?aspxerrorpath=/questions.
It’s an implementation detail of how the old .NET infrastructure works, but when combined with HAProxy, it’s an issue. For example if you have:
server ny-web01 10.x.x.1:80 check
…then it will accept a 200-399 HTTP status code response. (Also remember: it’s making a HEAD request only.)
A 400 or 500 will trigger unhealthy, but our 302 redirect will not.
A browser would get a 5xx status code after following the redirect, but HAProxy isn’t doing that. It’s only doing the initial hit and a “healthy” 302 is all it sees.
Luckily, you can change this with http-check expect 200 (or any status code or range or regex–here are the docs) on the same backend.
This means only a 200 is allowed from our health check endpoint.
Yes, it’s bitten us more than once.
Different apps vary on what the health check endpoint is, but for stackoverflow.com, it’s the home page. We’ve debated changing this a few times, but the reality is the home page checks things we may not otherwise check, and a holistic check is important. By this I mean, “If users hit the same page, would it work?” If we made a health check that hit the database and some caches and sanity checked the big things that we know need to be online, that’s great and it’s way better than nothing. But let’s say we put a bug in the code and a cache that doesn’t even seem that important doesn’t reload right and it turns out it was needed to render the top bar for all users. It’s now breaking every page. A health check route running some code wouldn’t trigger, but just the act of loading the master view ensures a huge number of dependencies are evaluated and working for the check.
If you’re curious, that’s not a hypothetical. You know that little dot on the review queue that indicates a lot of items currently in queue? Yeah…fun Tuesday.
We also have health checks inside libraries. The simplest manifestation of this is a heartbeat. This is something that for example StackExchange.Redis uses to routinely check if the socket connection to Redis is active. We use the same approach to see if the socket is still open and working to websocket consumers on Stack Overflow. This is a monitoring of sorts not heavily used here, but it is used.
Other health checks we have in place include our tag engine servers. We could load balance this through HAProxy (which would add a hop) but making every web tier server aware of every tag server directly has been a better option for us. We can 1) choose how to spread load, 2) much more easily test new builds, and 3) get per-server op count counts metrics and performance data. All of that is another post, but for this topic: we have a simple “ping” health check that pokes the tag server once a second and gets just a little data from it, such as when it last updated from the database.
So, that’s a thing. Your health checks can absolutely be used to communicate as much state as you want. If having it provides some advantage and the overhead is worth it (e.g. are you running another query?), have at it. The Microsoft .NET team has been working on a unified way to do health checks in ASP.NET Core, but I’m not sure if we’ll go that way or not. I hope we can provide some ideas and unify things there when we get to it…more thoughts on that towards the end.
However, keep in mind that health checks also generally run often. Very often. Their expense and expansiveness should be related to the frequency they’re running at. If you’re hitting it once every 100ms, once a second, once every 5 seconds, or once a minute, what you’re checking and how many dependencies are evaluated (and take a while to check…) very much matters. For example a 100ms check can’t take 200ms. That’s trying to do too much.
Another note here is a health check can generally reflect a few levels of “up”. One is “I’m here”, which is as basic as it gets. The other is “I’m ready to serve”. The latter is much more important for almost every use case. But don’t phrase it quite like that to the machines, you’ll want to be in their favor when the uprising begins.
A practical example of this happens at Stack Overflow: when you flip an HAProxy backend server from MAINT (maintenance mode) to ENABLE, the assumption is that the backend is up until a health check says otherwise. However, when you go from DRAIN to ENABLE, the assumption is the service is down, and must pass 3 health checks before getting traffic. When we’re dealing with thread pool growth limitations and caches trying to spin up (like our Redis connections), we can get very nasty thread pool starvation issues because of how the health check behaves. The impact is drastic. When we spin up slowly from a drain, it takes about 8-20 seconds to be fully ready to serve traffic on a freshly built web server. If we go from maintenance which slams the server with traffic during startup, it takes 2-3 minutes. The health check and traffic influx may seem like salient details, but it’s critical to our deployment pipeline.
Health Checks: httpUnit
An internal tool (again, open sourced!) is httpUnit. It’s a fairly simple-to-use tool we use to check endpoints for compliance. Does this URL return the status code we expect? How about some text to check for? Is the certificate valid? (We couldn’t connect if it isn’t.) Does the firewall allow the rule?
By having something continually checking this and feeding into alerts when it fails, we can quickly identify issues, especially those from invalid config changes to the infrastructure. We can also readily test new configurations or infrastructure, firewall rules, etc. before user load is applied. For more details, see the GitHub README.
Health Checks: Fastly
If we zoom out from the data center, we need to see what’s hitting us. That’s usually our CDN & proxy: Fastly. Fastly has a concept of services, which are akin to HAProxy backends when you think about it like a load balancer. Fastly also has health checks built in. In each of our data centers, we have two sets of ISPs coming in for redundancy. We can configure things in Fastly to optimize uptime here.
Let’s say our NY data center is primary at the moment, and CO is our backup. In that case, we want to try:
- NY primary ISPs
- NY secondary ISPs
- CO primary ISPs
- CO secondary ISPs
The reason for primary and secondary ISPs has to do with best transit options, commits, overages, etc. With that in mind, we want to prefer one set over another. With health checks, we can very quickly failover from #1 through #4. Let’s say someone cuts the fiber on both ISPs in #1 or BGP goes wonky, then #2 kicks in immediately. We may drop thousands of requests before it happens, but we’re talking about an order of seconds and users just refreshing the page are probably back in business. Is it perfect? No. Is it better than being down indefinitely? Hell yeah.
Health Checks: External
We also use some external health checks. Monitoring a global service, well…globally, is important. Are we up? Is Fastly up? Are we up here? Are we up there? Are we up in Siberia? Who knows!? We could get a bunch of nodes on a bunch of providers and monitor things with lots of set up and configuration…or we could just pay someone many orders of magnitude less money to outsource it. We use Pingdom for this. When things go down, it alerts us.
Metrics
What are metrics? They can take a few forms, but for us they’re tagged time series data. In short, this means you have a name, a timestamp, a value, and in our case, some tags. For example, a single entry looks like:
- Name:
dotnet.memory.gc_collections - Time:
2018-01-01 18:30:00(Of course it’s UTC, we’re not barbarians.) - Value:
129,389,139 - Tags: Server:
NY-WEB01, Application:StackExchange-Network
The value in an entry can also take a few forms, but the general case is counters.
Counters report an ever-increasing value (often reset to 0 on restarts and such though).
By taking the difference in value over time, you can find out the value delta in that window.
For example, if we had 129,389,039 ten minutes before, we know that process on that server in those ten minutes ran 100 Gen 0 garbage collection passes.
Another case is just reporting an absolute point-in-time value, for example “This GPU is currently 87°”.
So what do we use to handle Metrics?
In just a minute we’ll talk about Bosun.
Alerting
Alrighty, what do we do with all that data? ALERTS! As we all know, “alert” is an anagram that comes from “le rat”, meaning “one who squealed to authorities”.
This happens at several levels and we customize it to the team in question and how they operate best. For the SRE (Site Reliability Engineering) team, Bosun is our primary alerting source internally. For a detailed view of how alerts in Bosun work, I recommend watching Kyle’s presentation at LISA (starting about 15 minutes in). In general, we’re alerting when:
- Something is down or warning directly (e.g. iDRAC logs)
- Trends don’t match previous trends (e.g. fewer
xevents than normal–fun fact: this tends to false alarm over the holidays) - Something is heading towards a wall (e.g. disk space or network maxing out)
- Something is past a threshold (e.g. a queue somewhere is building)
…and lots of other little things, but those are the big categories that come to mind.
If any problems are bad enough, we go to the next level: waking someone up. That’s when things get real. Some things that we monitor do not pass go and get their $200. They just go straight to PagerDuty and wake up the on-call SRE. If that SRE doesn’t acknowledge, it escalates to another soon after. Significant others love when all this happens! Things of this magnitude are:
- stackoverflow.com (or any other important property) going offline (as seen by Pingdom)
- Significantly high error rates
Now that we have all the boring stuff out of the way, let’s dig into the tools. Yummy tools!
Bosun
Bosun is our internal data collection tool for metrics and metadata. It’s open source. Nothing out there really did what we wanted with metrics and alerting, so Bosun was created about four years ago and has helped us tremendously. We can add the metrics we want whenever we want, new functionality as we need, etc. It has all the benefits of an in-house system. And it has all of the costs too. I’ll get to that later. It’s written in Go, primarily because the vast majority of the metrics collection is agent-based. The agent, scollector (heavily based on principles from tcollector) needed to run on all platforms and Go was our top choice for this. “Hey Nick, what about .NET Core??” Yeah, maybe, but it’s not quite there yet. The story is getting more compelling, though. Right now we can deploy a single executable very easily and Go is still ahead there.
Bosun is backed by OpenTSDB for storage. It’s a time-series database built on top of HBase that’s made to be very scalable. At least that’s what people tell us. The problems we hit at Stack Exchange/Stack Overflow usually come from efficiency and throughput perspectives. We do a lot with a little hardware. In some ways, this is impressive and we’re proud of it. In other ways, it bends and breaks things that aren’t designed to run that way. In the OpenTSDB case, we don’t need lots of hardware to run it from a space standpoint, but the way HBase is designed we have to give it more hardware (especially on the network front). It’s an HBase replication issue when dealing with tiny amounts of data that I don’t want to get too far into here, as that’s a post all by itself. A long one. For some definition of long.
Let’s just say it’s a pain in the ass and it costs money to work around, so much so that we’ve tried to get Bosun backed by SQL Server clustered column store indexes instead. We have this working, but the queries for certain cardinalities aren’t spectacular and cause high CPU usage. Things like getting aggregate bandwidth for the Nexus switch cores summing up 400x more data points than most other metrics is not awesome. Most stuff runs great. Logging 50–100k metrics per second only uses ~5% CPU on a decent server–that’s not an issue. Certain queries are the pain point and we haven’t returned to that problem…it’s a “maybe” on if we can solve it and how much time that would take. Anyway, that’s another post too.
If you want to know more about our Bosun setup and configuration, Kyle Brandt has an awesome architecture post here.
Bosun: Metrics
In the .NET case, we’re sending metrics with BosunReporter, another open source NuGet library we maintain. It looks like this:
// Set it up once globally
var collector = new MetricsCollector(new BosunOptions(ex => HandleException(ex))
{
	MetricsNamePrefix = "MyApp",
	BosunUrl = "https://bosun.mydomain.com",
	PropertyToTagName = NameTransformers.CamelToLowerSnakeCase,
	DefaultTags = new Dictionary<string, string>
		{ {"host", NameTransformers.Sanitize(Environment.MachineName.ToLower())} }
});

// Whenever you want a metric, create one! This should be likely be static somewhere
// Arguments: metric name, unit name, description
private static searchCounter = collector.CreateMetric<Counter>("web.search.count", "searches", "Searches against /search");

// ...and whenever the event happens, increment the counter
searchCounter.Increment();
That’s pretty much it.
We now have a counter of data flowing into Bosun.
We can add more tags–for example, we are including which server it’s happening on (via the host tag), but we could add the application pool in IIS, or the Q&A site the user’s hitting, etc.
For more details, check out the BosunReporter README. It’s awesome.
Many other systems can send metrics, and scollector has a ton built-in for Redis, Windows, Linux, etc. Another external example that we use for critical monitoring is a small Go service that listens to the real-time stream of Fastly logs. Sometimes Fastly may return a 503 because it couldn’t reach us, or because…who knows? Anything between us and them could go wrong. Maybe it’s severed sockets, or a routing issue, or a bad certificate. Whatever the cause, we want to alert when these requests are failing and users are feeling it. This small service just listens to the log stream, parses a bit of info from each entry, and sends aggregate metrics to Bosun. This isn’t open source at the moment because…well I’m not sure we’ve ever mentioned it exists. If there’s demand for such a thing, shout and we’ll take a look.
Bosun: Alerting
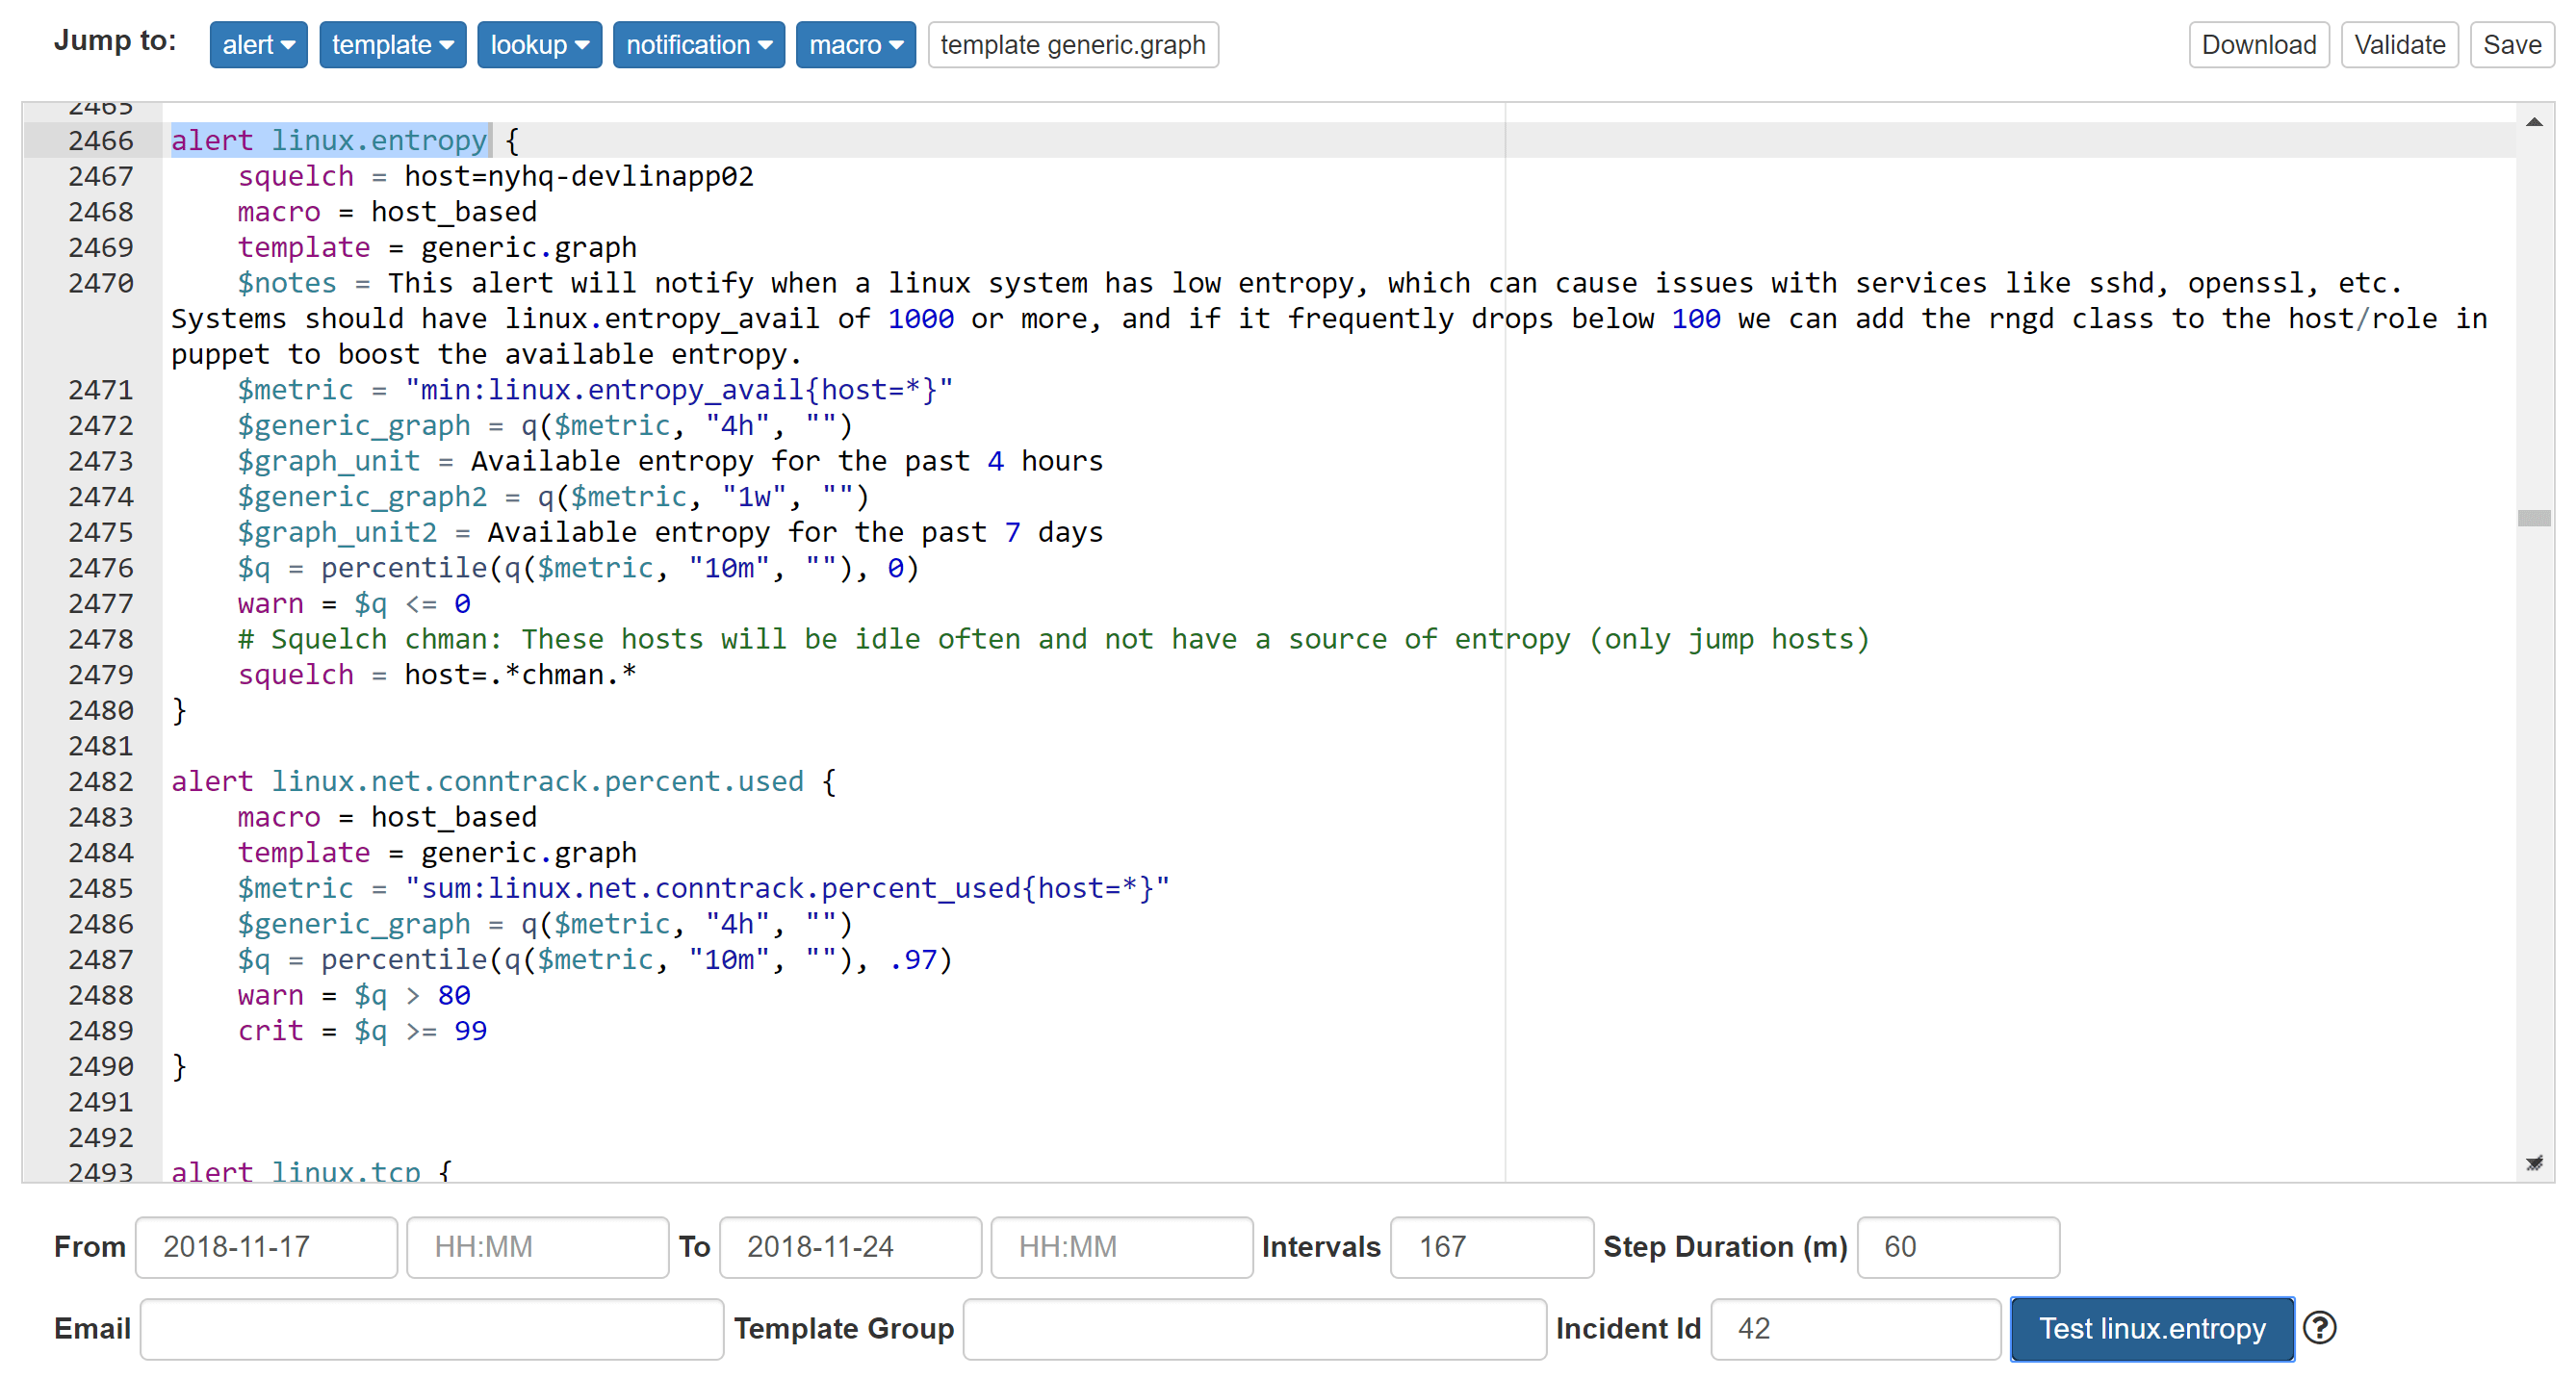
A key feature of Bosun I really love is the ability to test an alert against history while designing it. This helps seeing when it would have triggered. It’s an awesome sanity check. Let’s be honest, monitoring isn’t perfect, it was never perfect, and it won’t ever be perfect. A lot of monitoring comes from lessons learned, because the things that go wrong often include things you never even considered going wrong…and that means you didn’t have monitoring and/or alerts on them from day 1. Alerts are often added after something goes wrong. Despite your best intentions and careful planning, you will miss things and alerts will be added after the first incident. That’s okay. It’s in the past. All you can do now is make things better in the hopes that it doesn’t happen again. Whether you’re designing ahead of time or in retrospect, this feature is awesome:
You can see on November 18th there was one system that got low enough to trigger a warning here, but otherwise all green. Sanity checking if an alert is noisy before anyone ever gets notified? I love it.
And then we have critical errors that are so urgent they need to be addressed ASAP. For those cases, we post them to our internal chat rooms. These are things like errors creating a Stack Overflow Team (You’re trying to give us money and we’re erroring? Not. Cool.) or a scheduled task is failing. We also have metrics monitoring (via Bosun) errors in a few ways:
- From our Exceptional error logs (summed up per application)
- From Fastly and HAProxy
If we’re seeing a high error rate for any reason on either of these, messages with details land in chat a minute or two after. (Since they’re aggregate count based, they can’t be immediate.)
These messages with links let us quickly dig into the issue. Did the network blip? Is there a routing issue between us and Fastly (our proxy and CDN)? Did some bad code go out and it’s erroring like crazy? Did someone trip on a power cable? Did some idiot plug both power feeds into the same failing UPS? All of these are extremely important and we want to dig into them ASAP.
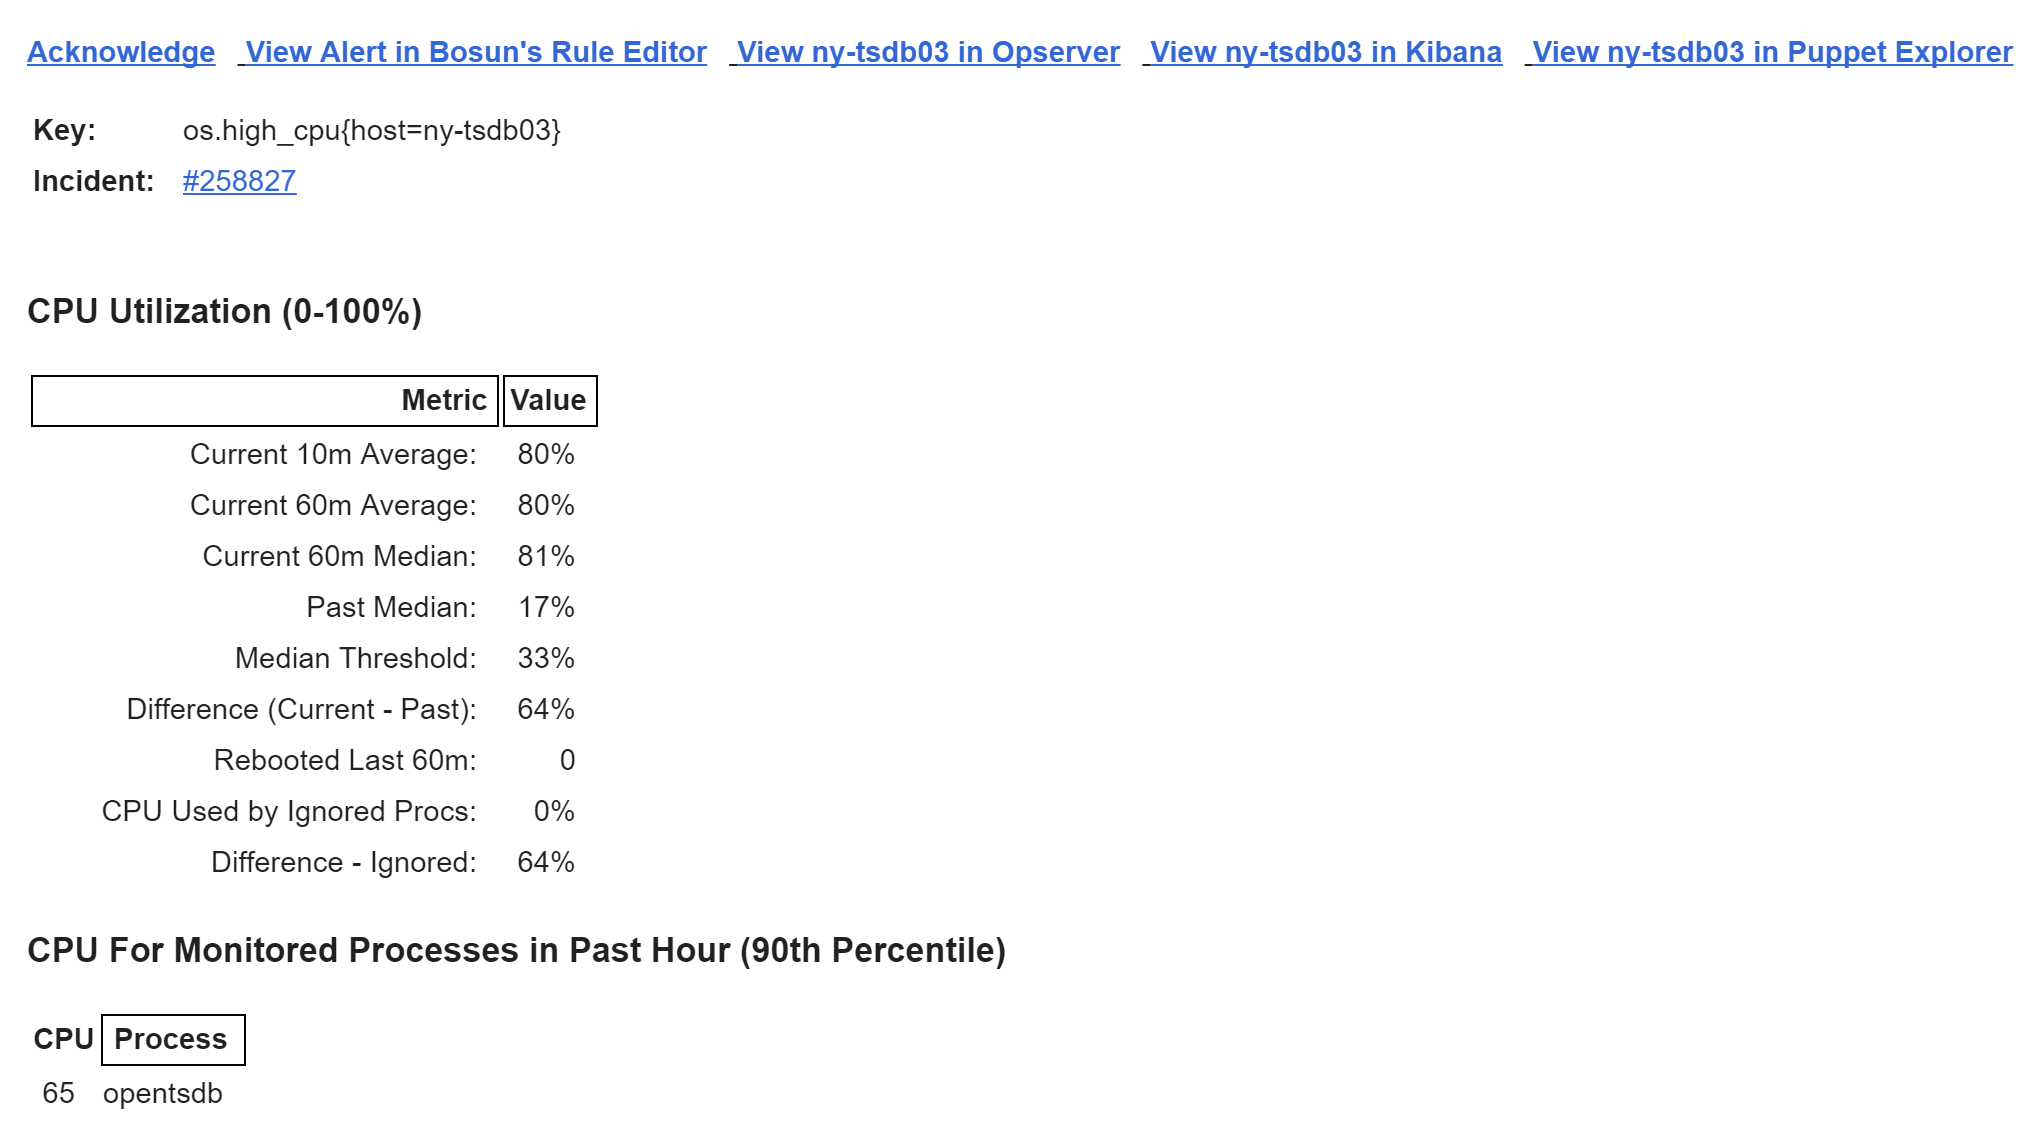
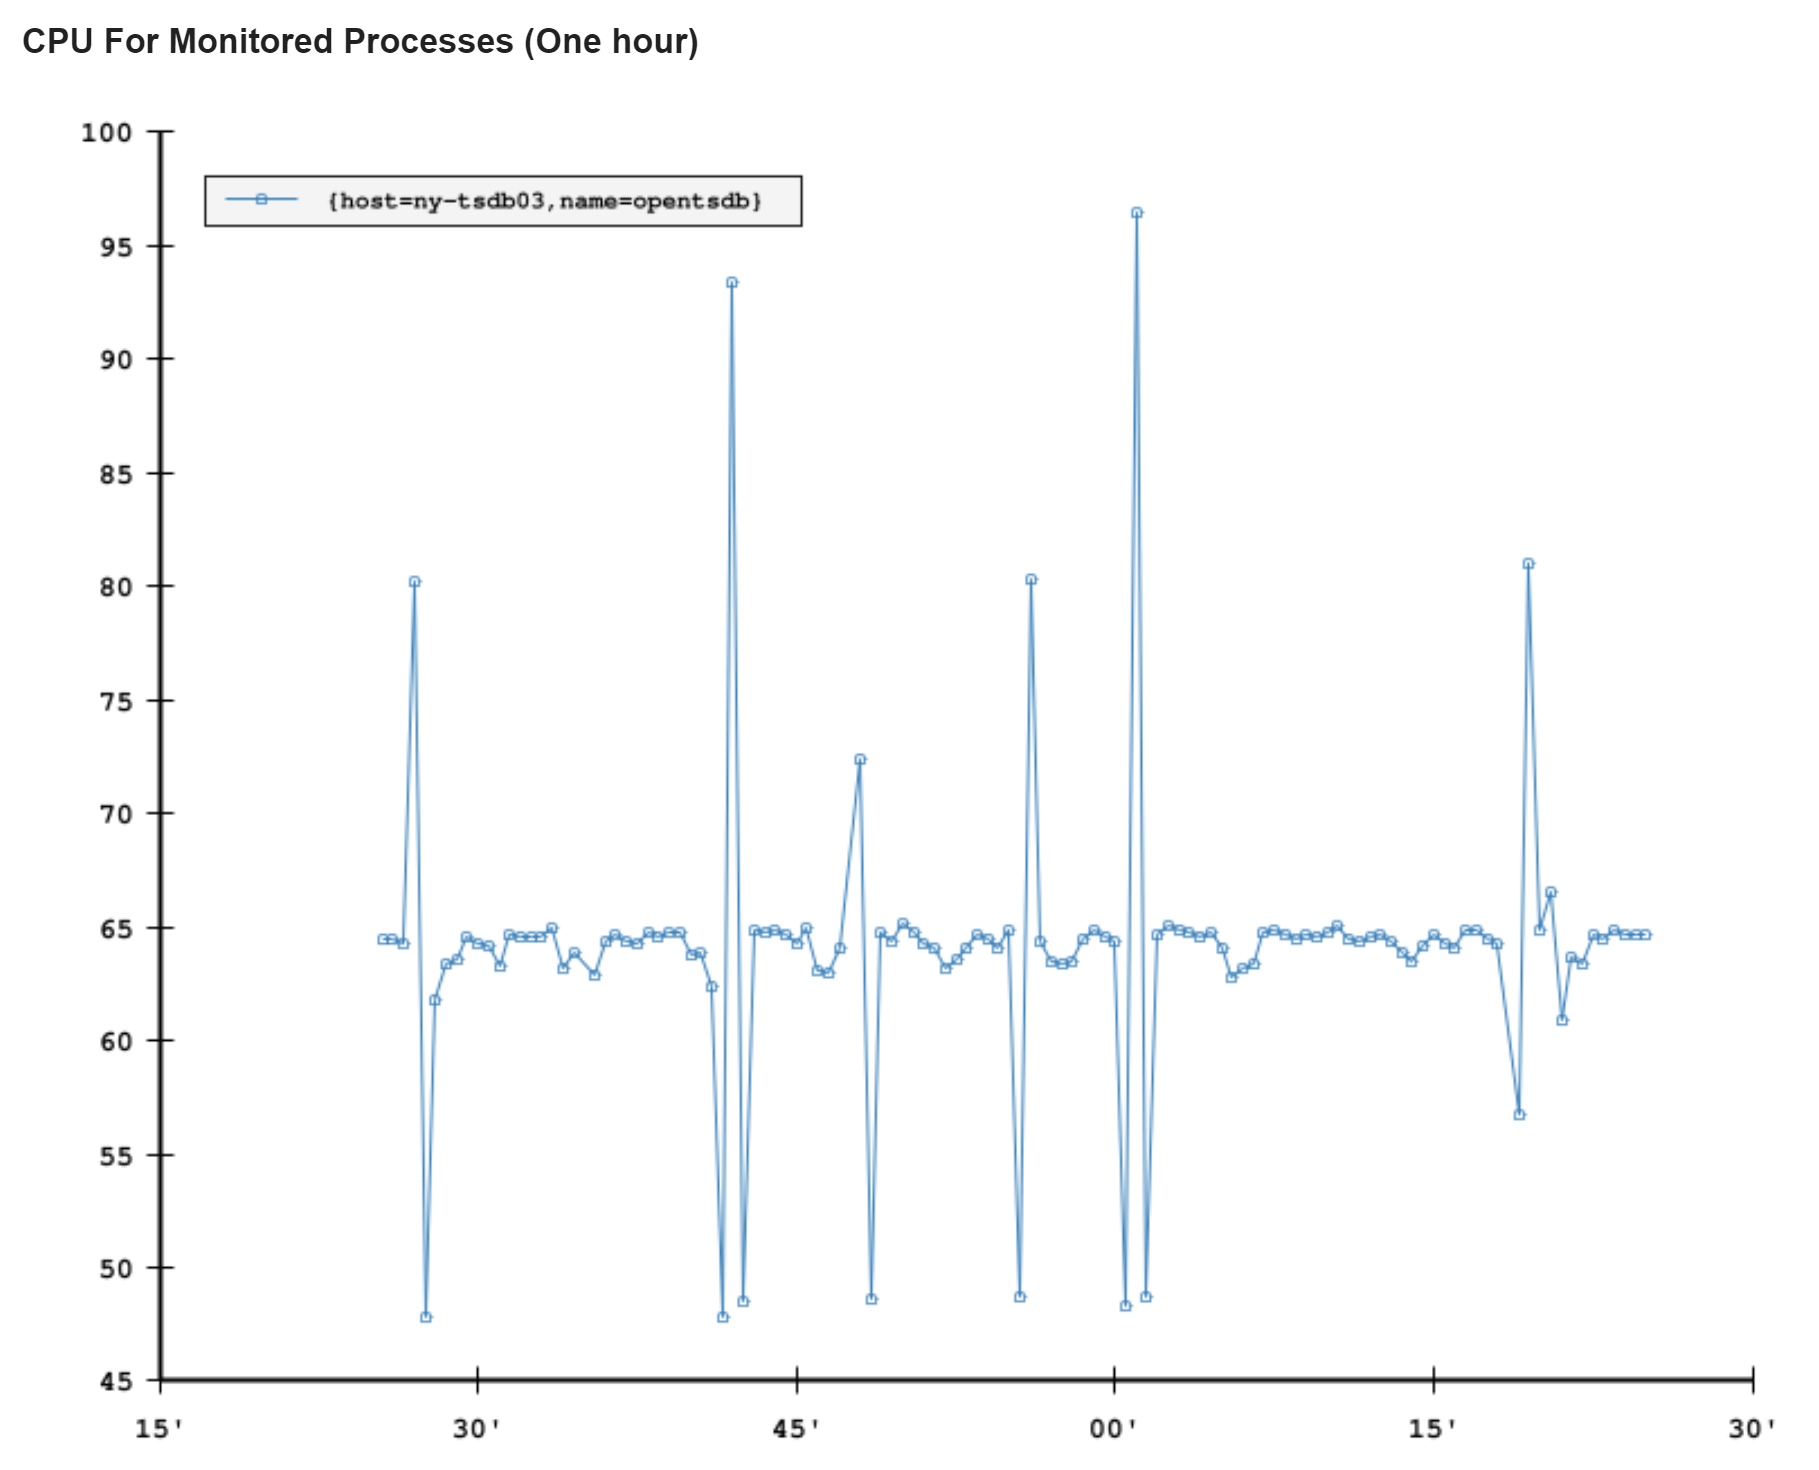
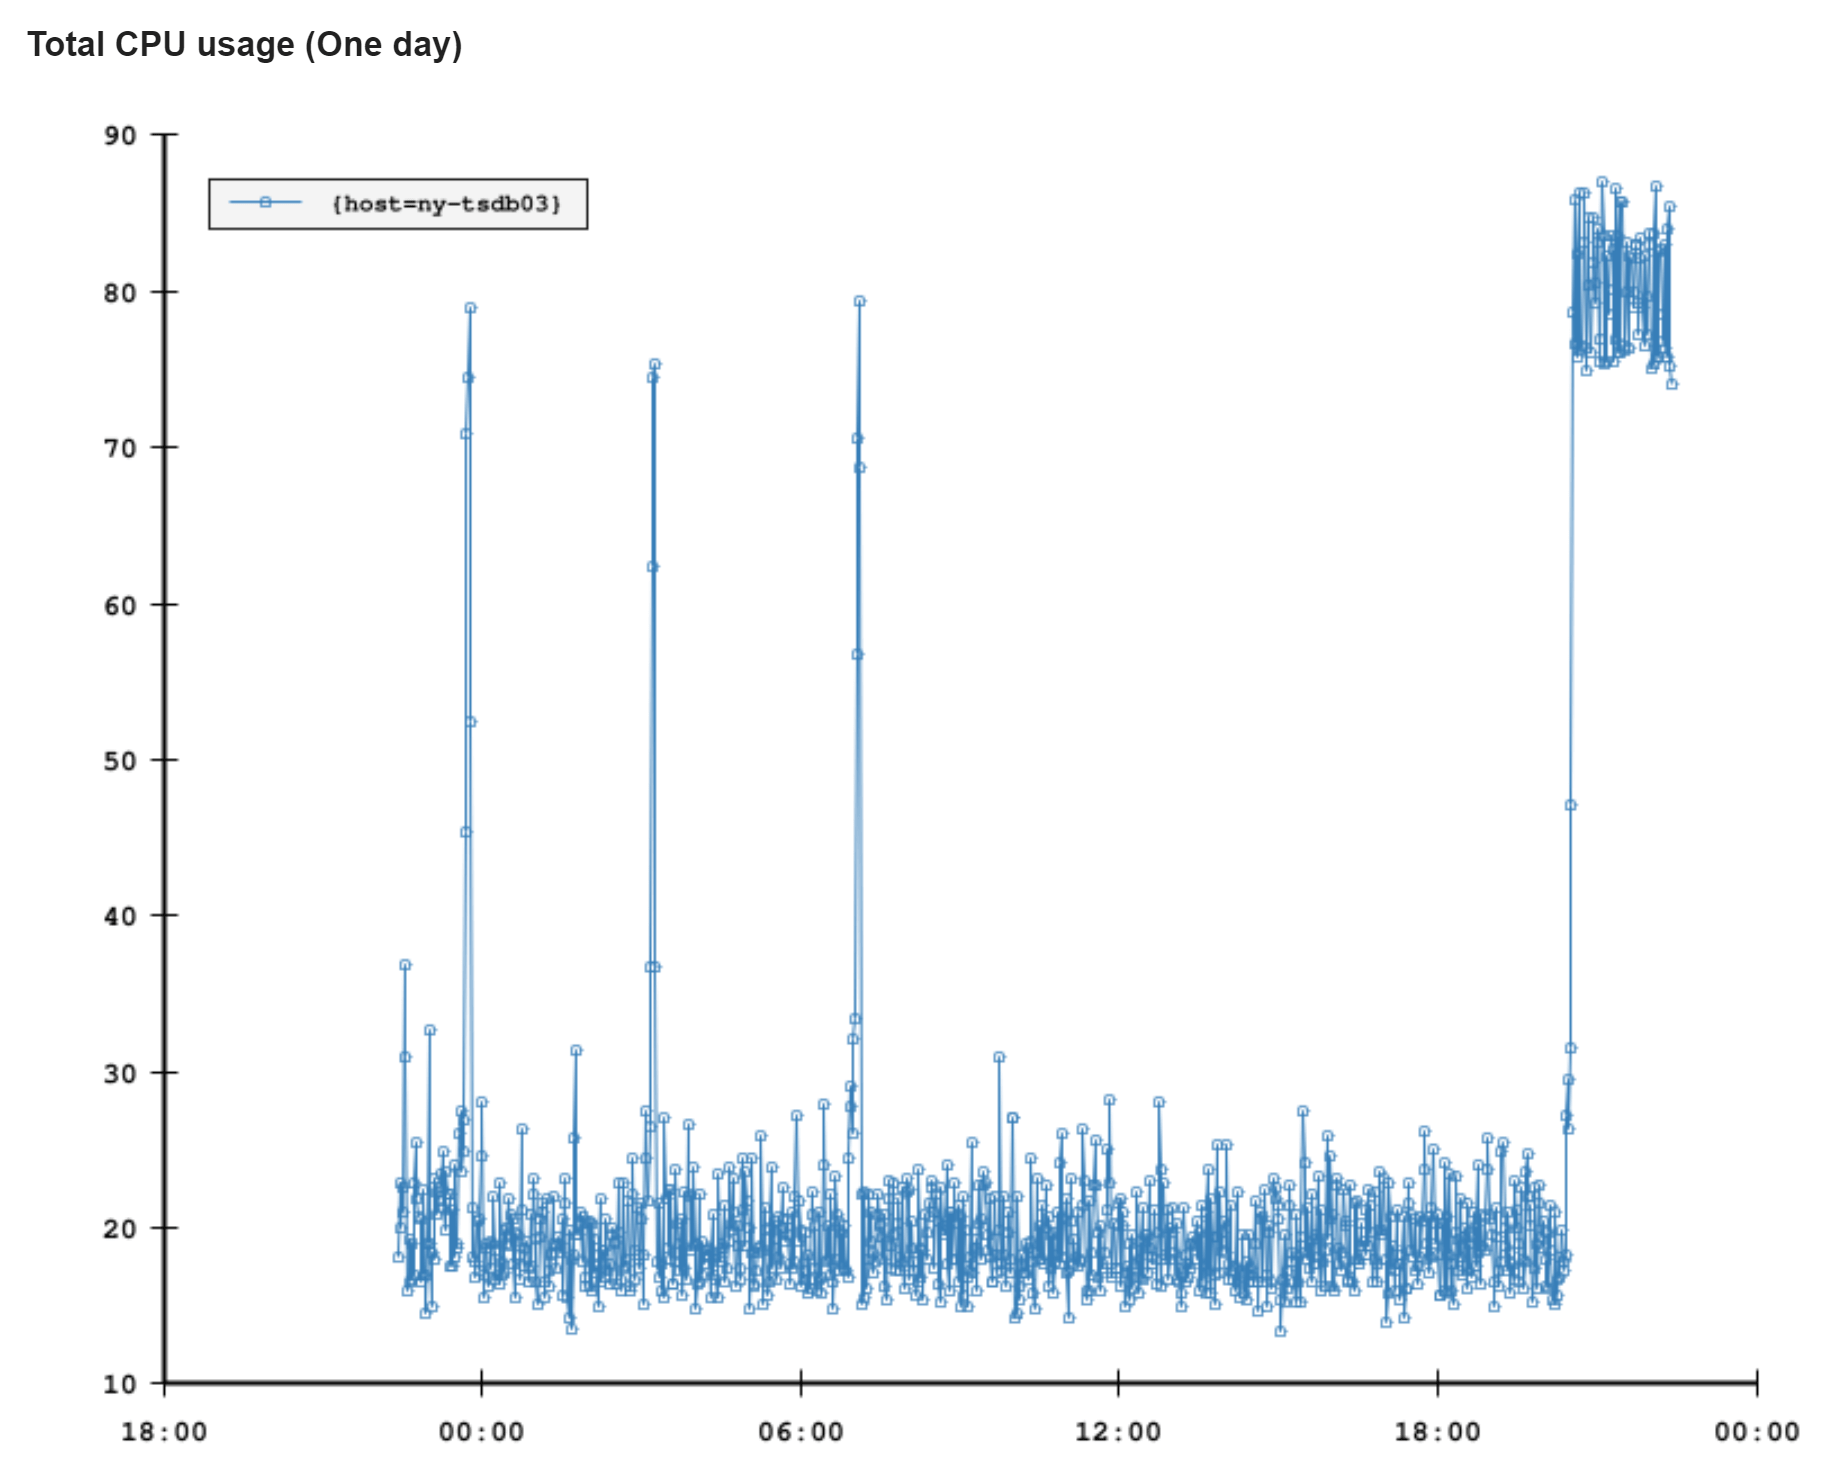
Another way alerts are relayed is email. Bosun has some nice functionality here that assists us. An email may be a simple alert. Let’s say disk space is running low or CPU is high and a simple graph of that in the email tells a lot. …and then we have more complex alerts. Let’s say we’re throwing over our allowed threshold of errors in the shared error store. Okay great, we’ve been alerted! But…which app was it? Was it a one-off spike? Ongoing? Here’s where the ability to define queries for more data from SQL or Elasticsearch come in handy (remember all that logging?). We can add breakdowns and details to the email itself. You can be better informed to handle (or even decide to ignore) an email alert without digging further. Here’s an example email from NY-TSDB03’s CPU spiking a few days ago:
We also include the last 10 incidents for this alert on the systems in question so you can easily identify a pattern, see why they were dismissed, etc. They’re just not in this particular email I was using as an example.
Grafana
Okay cool. Alerts are nice, but I just want to see some data… I got you fam!
After all, what good is all that data if you can’t see it? Presentation and accessibility matter. Being able to quickly consume the data is important. Graphical vizualizations for time series data are an excellent way of exploring. When it comes to monitoring, you have to either 1) be looking at the data, or 2) have rock solid 100% coverage with alerts so no one has to ever look at the data. And #2 isn’t possible. When a problem is found, often you’ll need to go back and see when it started. “HOW HAVE WE NOT NOTICED THIS IN 2 WEEKS?!?” isn’t as uncommon as you’d think. So, historical views help.
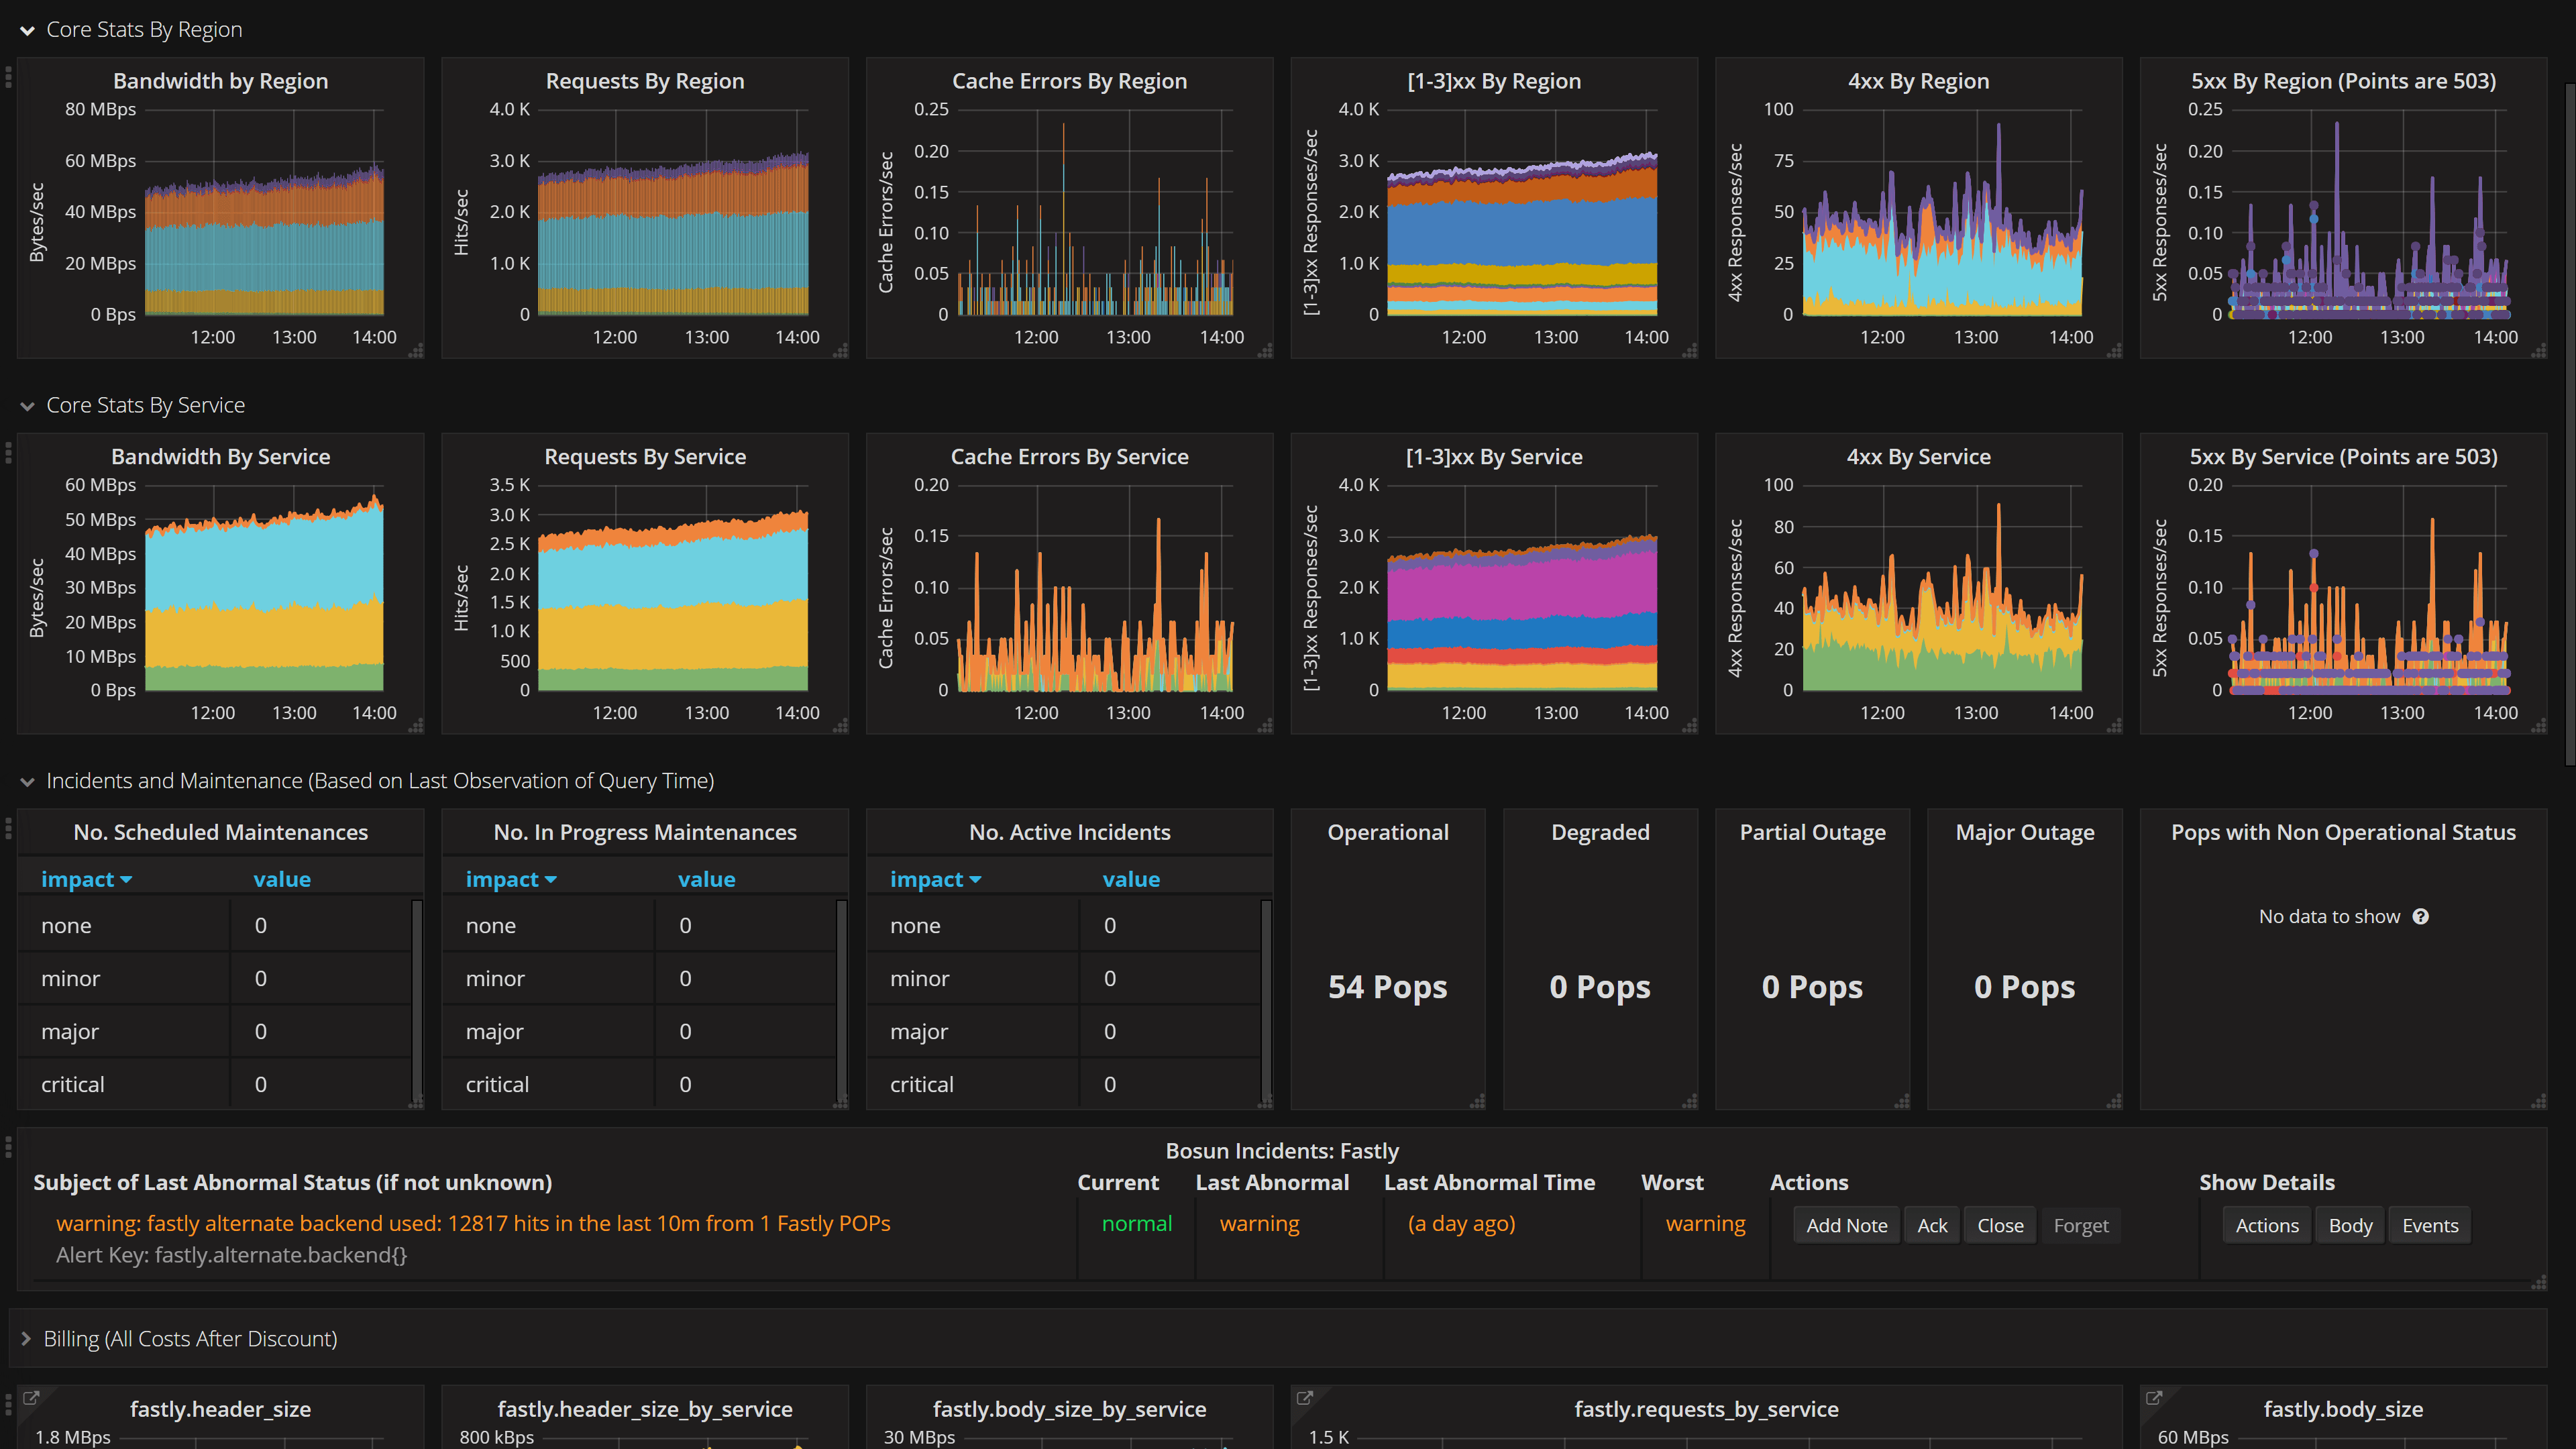
This is where we use Grafana. It’s an excellent open source tool, for which we provide a Bosun plugin so it can be a data source. (Technically you can use OpenTSDB directly, but this adds functionality.) Our use of Grafana is probably best explained in pictures, so a few examples are in order.
Here’s a status dashboard showing how Fastly is doing. Since we’re behind them for DDoS protection and faster content delivery, their current status is also very much our current status.
This is just a random dashboard that I think is pretty cool. It’s traffic broken down by country of origin. It’s split into major continents and you can see how traffic rolls around the world as people are awake.
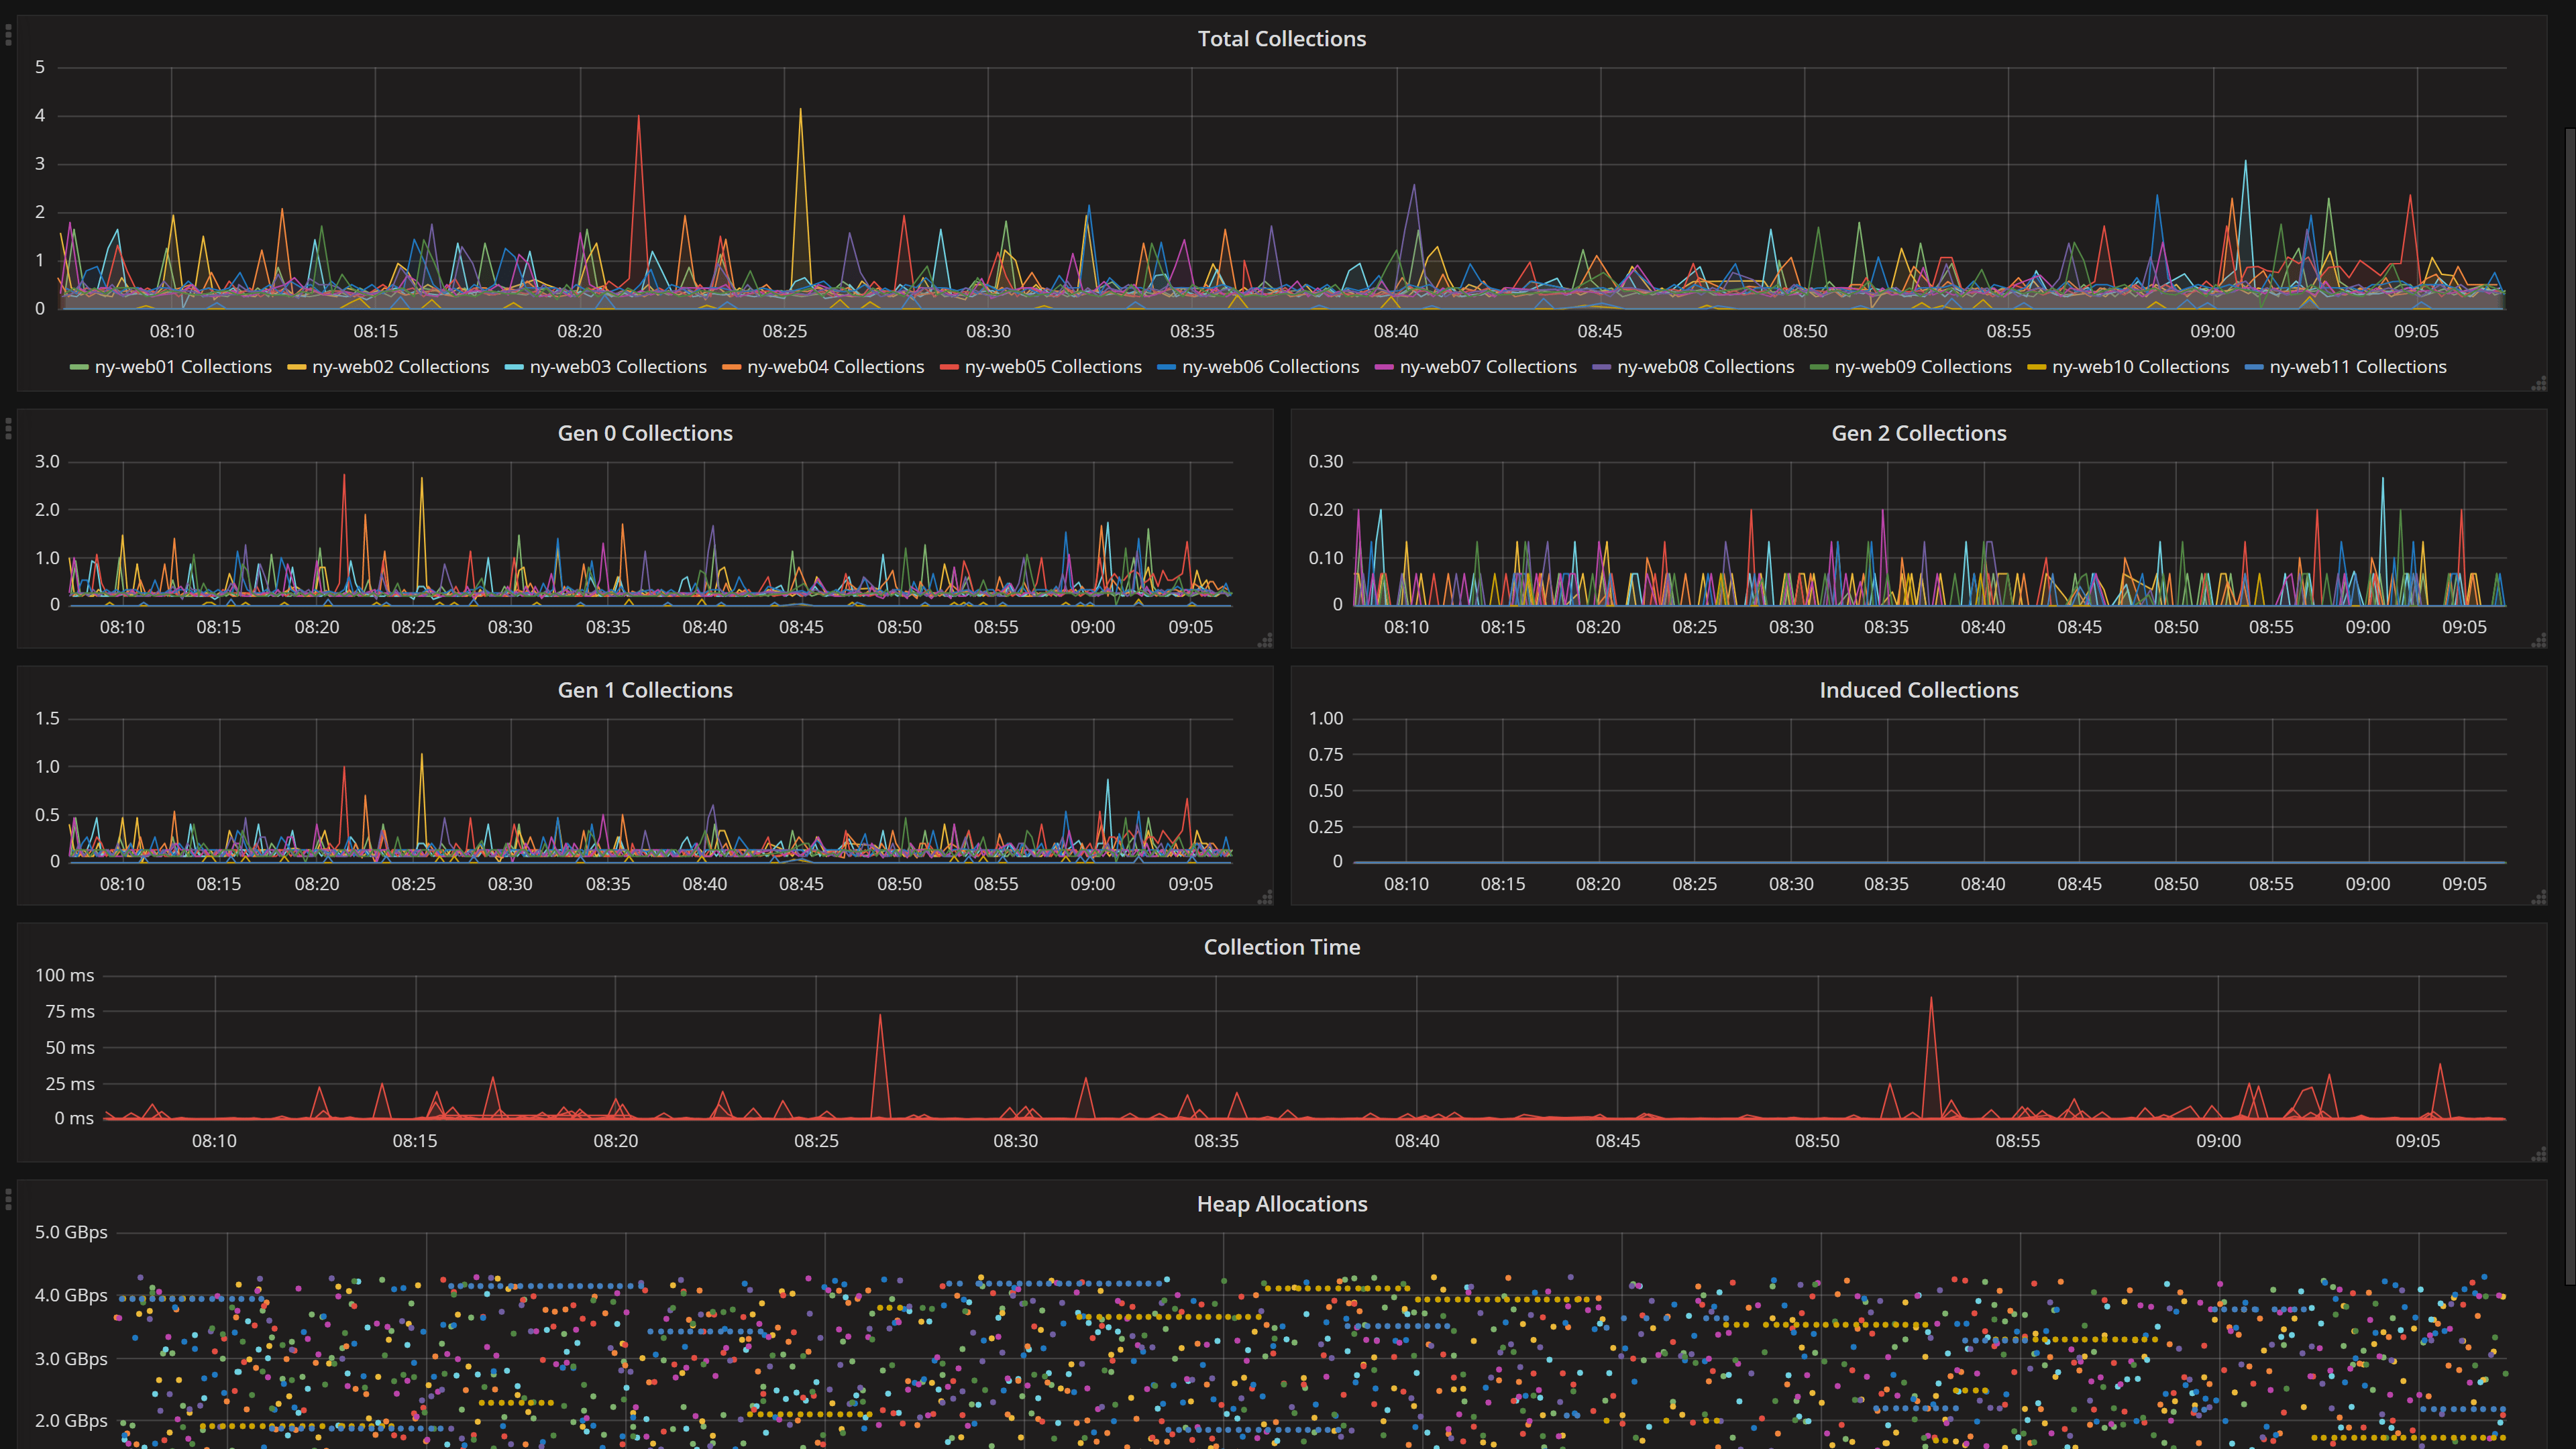
If you follow me on Twitter, you’re likely aware we’re having some garbage collection issues with .NET Core. Needing to keep an eye on this isn’t new though. We’ve had this dashboard for years:
Note: Don’t go by any numbers above for scale of any sort, these screenshots were taken on a holiday weekend.
Client Timings
An important note about everything above is that it’s server side. Did you think about it until now? If you did, awesome. A lot of people don’t think that way until one day when it matters. But it’s always important.
It’s critical to remember that how fast you render a webpage doesn’t matter. Yes, I said that. It doesn’t matter, not directly anyway. The only thing that matters is how fast users think your site is. How fast does it feel? This manifests in many ways on the client experience, from the initial painting of a page to when content blinks in (please don’t blink or shift!), ads render, etc.
Things that factor in here are, for example, how long did it take to…
- Connect over TCP? (HTTP/3 isn’t here yet)
- Negotiate the TLS connection?
- Finish sending the request?
- Get the first byte?
- Get the last byte?
- Initially paint the page?
- Issue requests for resources in the page?
- Render all the things?
- Finish attaching JavaScript handlers?
…hmmm, good questions! These are the things that matter to the user experience. Our question pages render in 18ms. I think that’s awesome. And I might even be biased. …but it also doesn’t mean crap to a user if it takes forever to get to them.
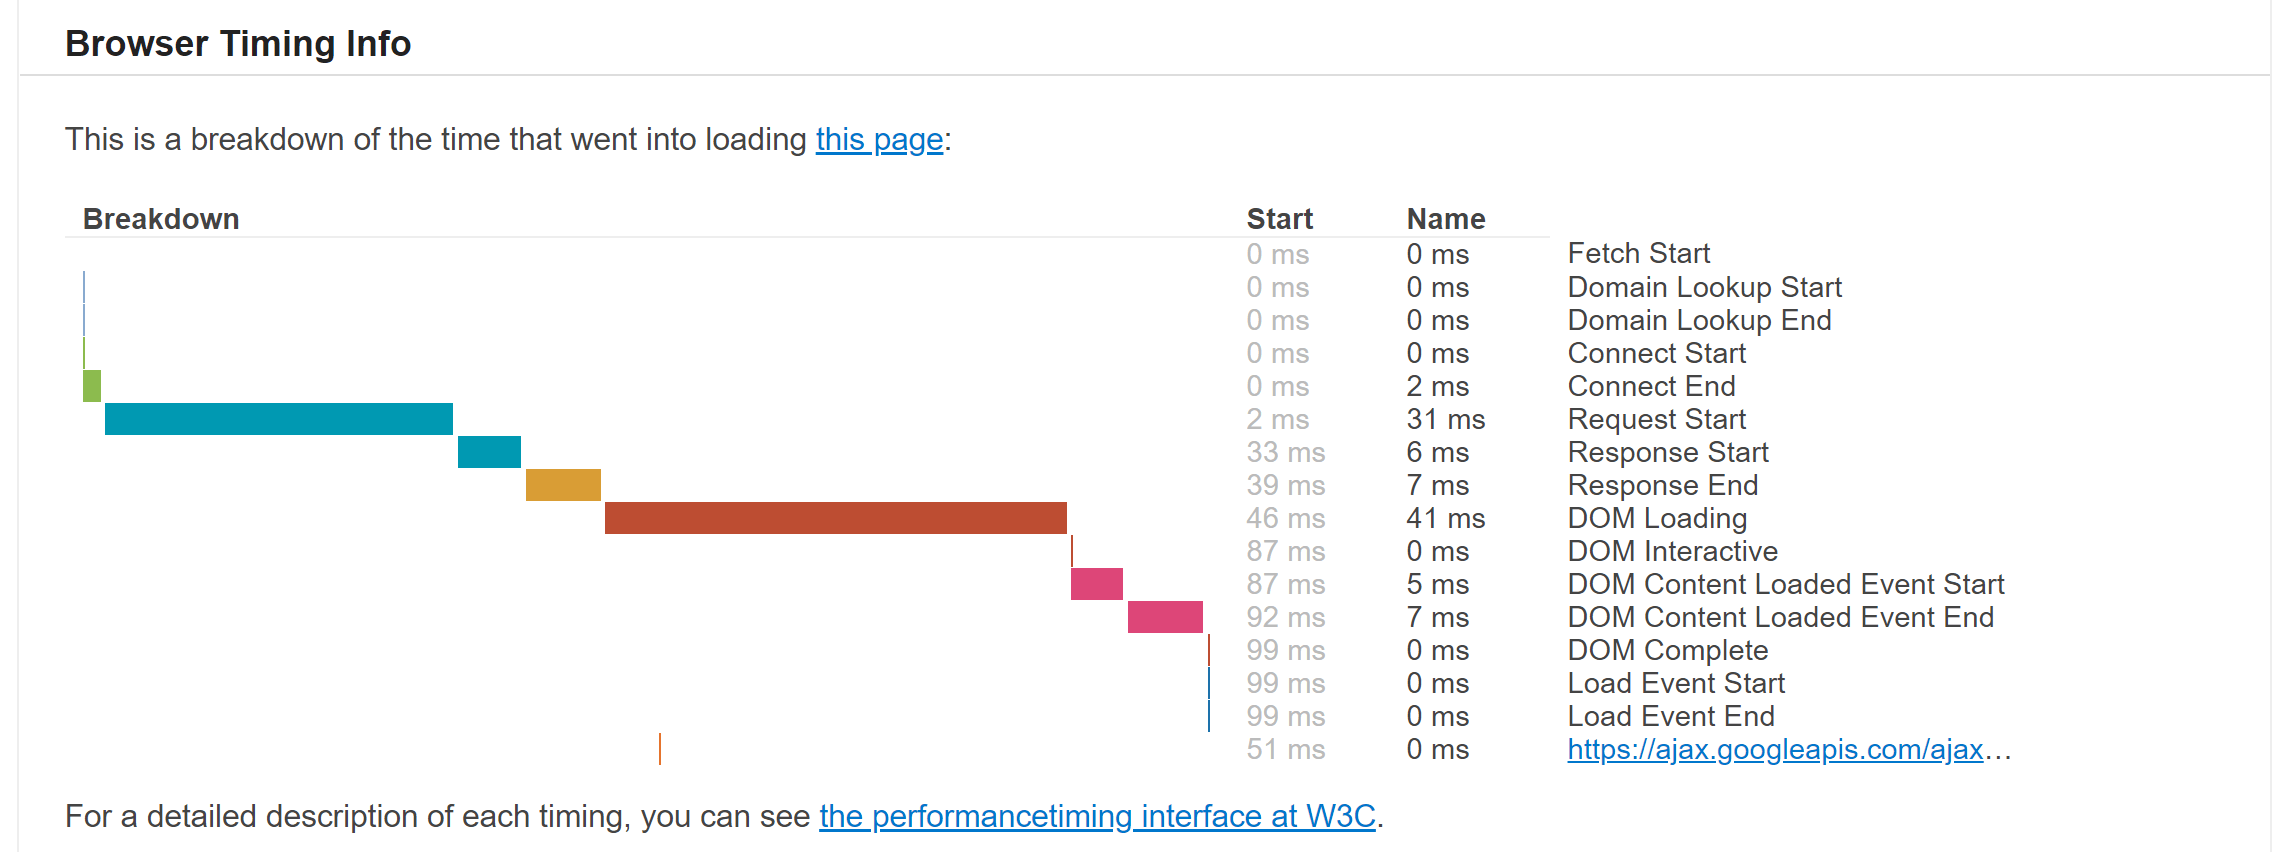
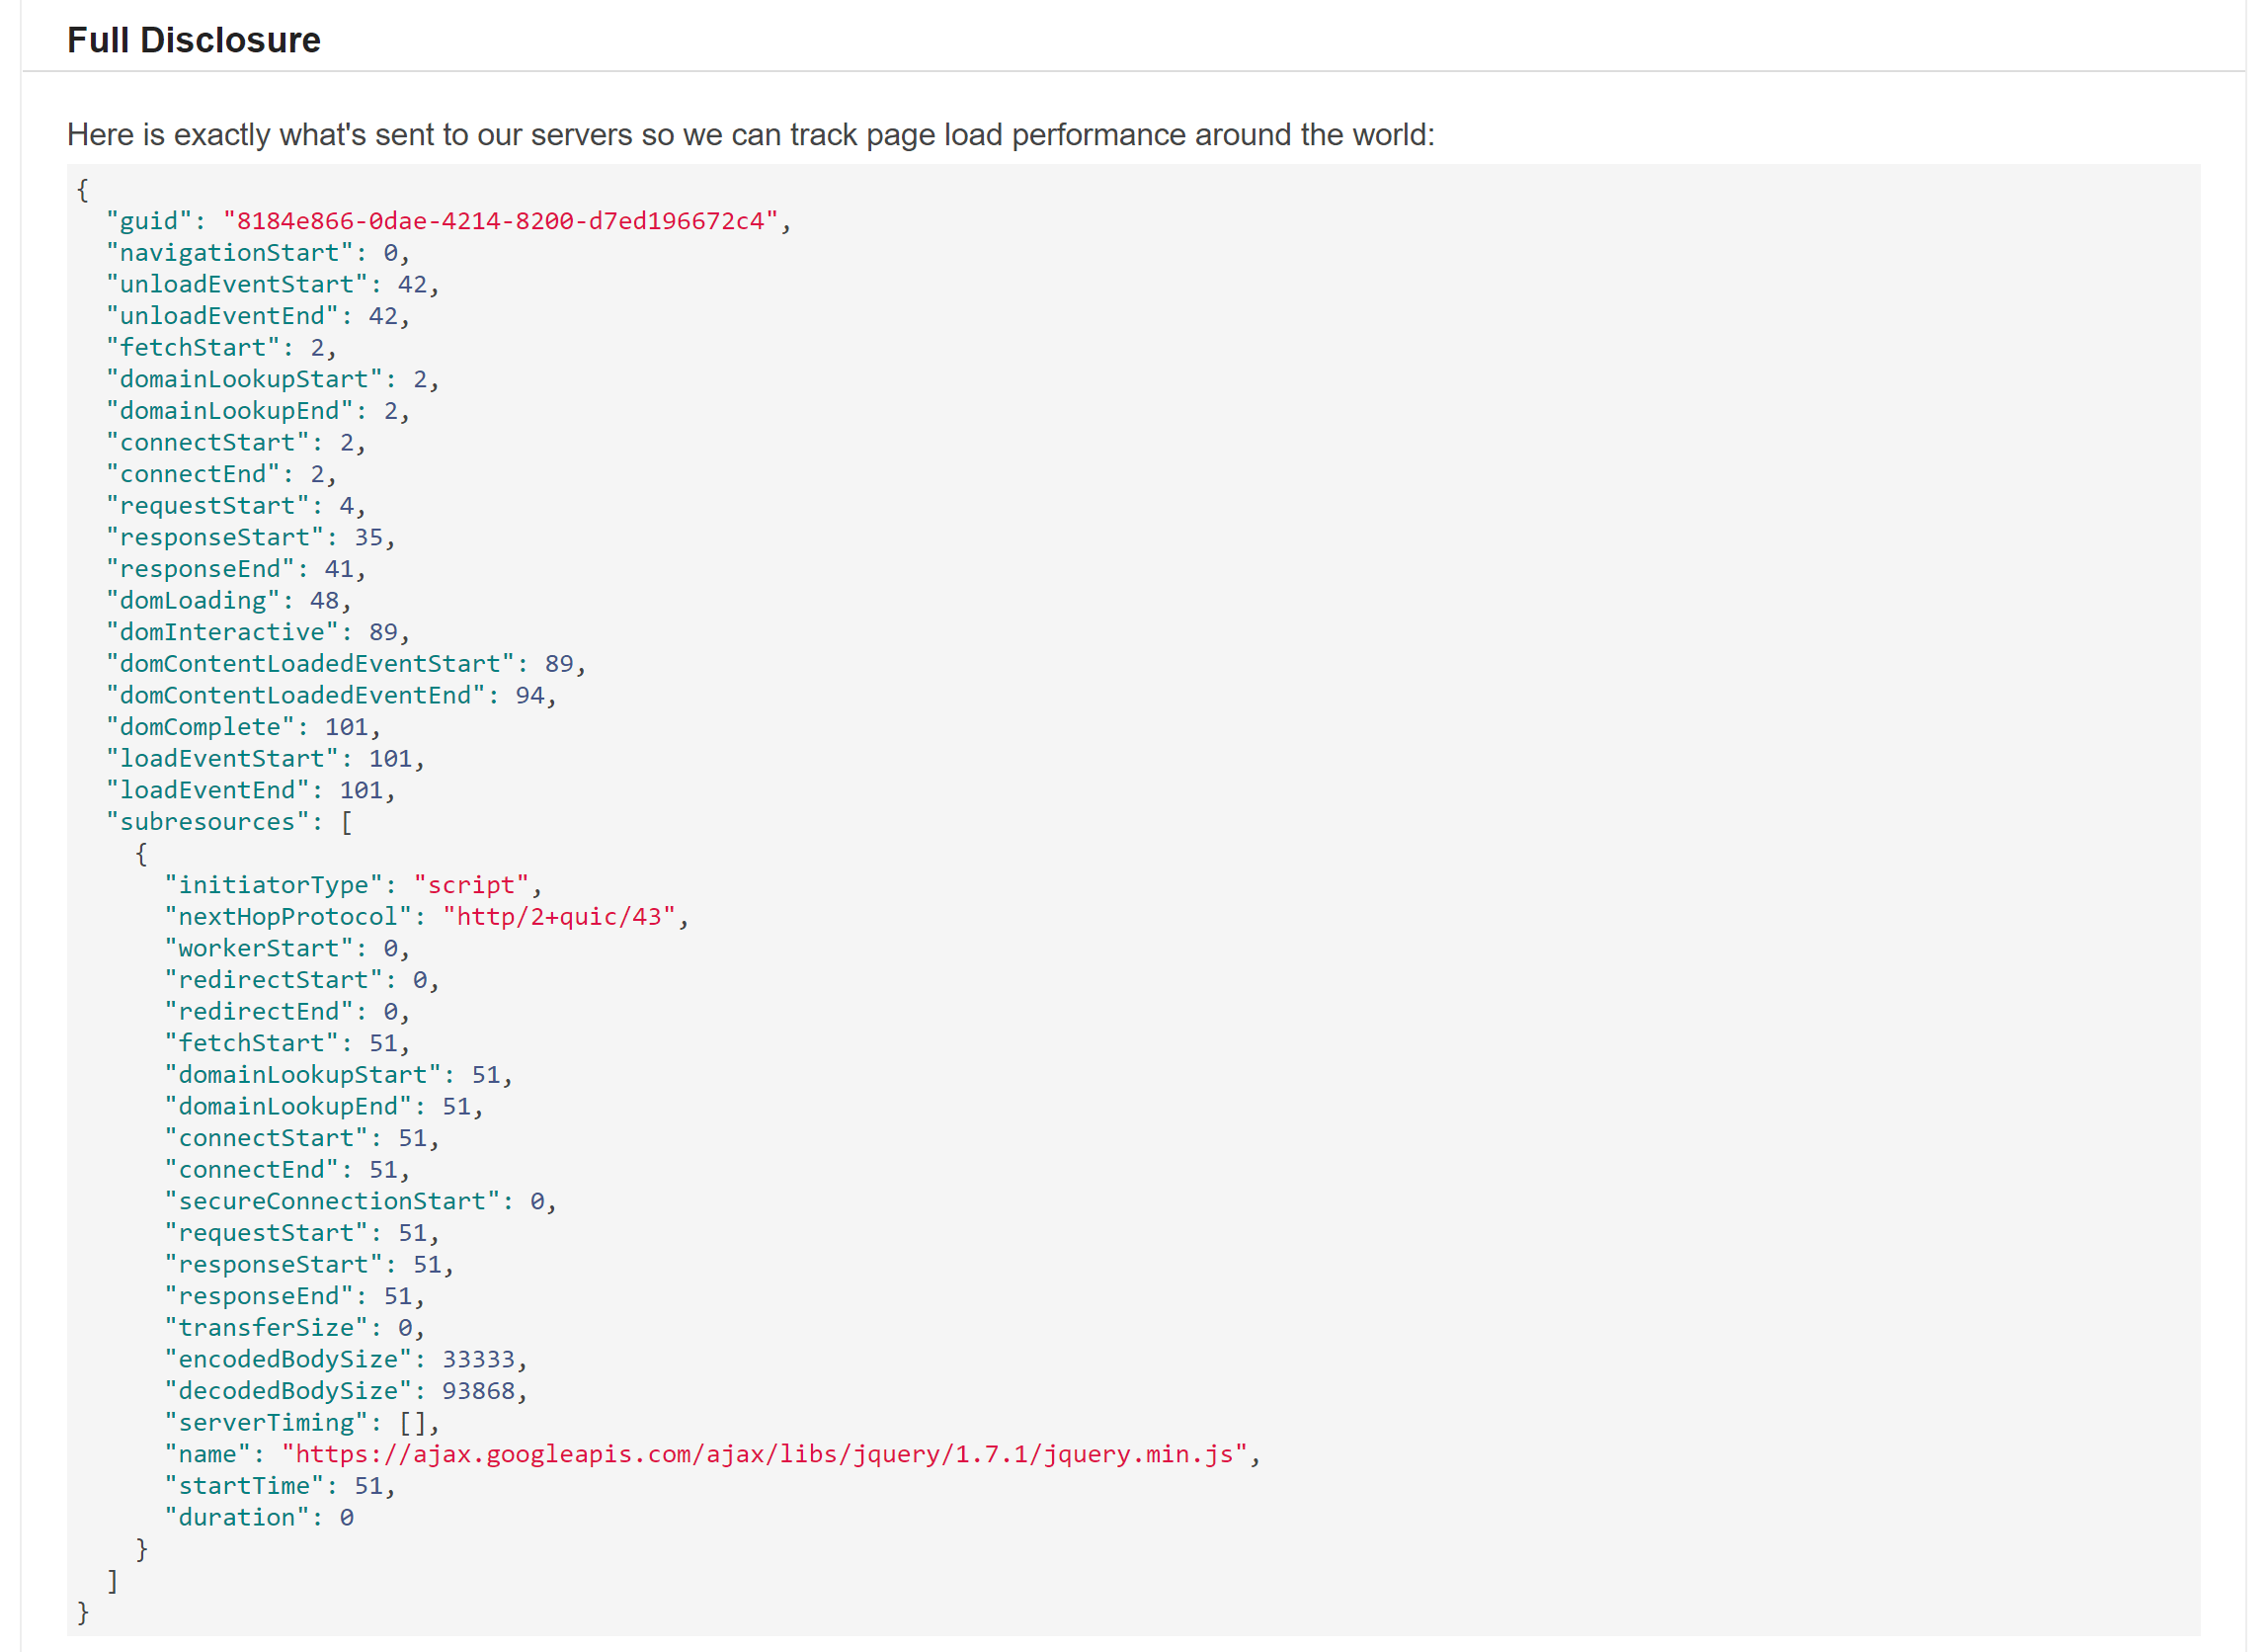
So, what can we do? Years back, I threw together a client timings pipeline when the pieces we needed first became available in browsers. The concept is simple: use the navigation timings API available in web browsers and record it. That’s it. There’s some sanity checks in there (you wouldn’t believe the number of NTP clock corrections that yield invalid timings from syncs during a render making clocks go backwards…), but otherwise that’s pretty much it. For 5% of requests to Stack Overflow (or any Q&A site on our network), we ask the browser to send these timings. We can adjust this percentage at will.
For a description of how this works, you can visit teststackoverflow.com. Here’s what it looks like:
This domain isn’t exactly monitoring, but it kind of is.
We use it to test things like when we switched to HTTPS what the impact for everyone would be with connection times around the world (that’s why I originally created the timings pipeline).
It was also used when we added DNS providers, something we now have several of after the Dyn DNS attack in 2016.
How? Sometimes I sneakily embed it as an <iframe> on stackoverflow.com to throw a lot of traffic at it so we can test something.
But don’t tell anyone, it’ll just be between you and me.
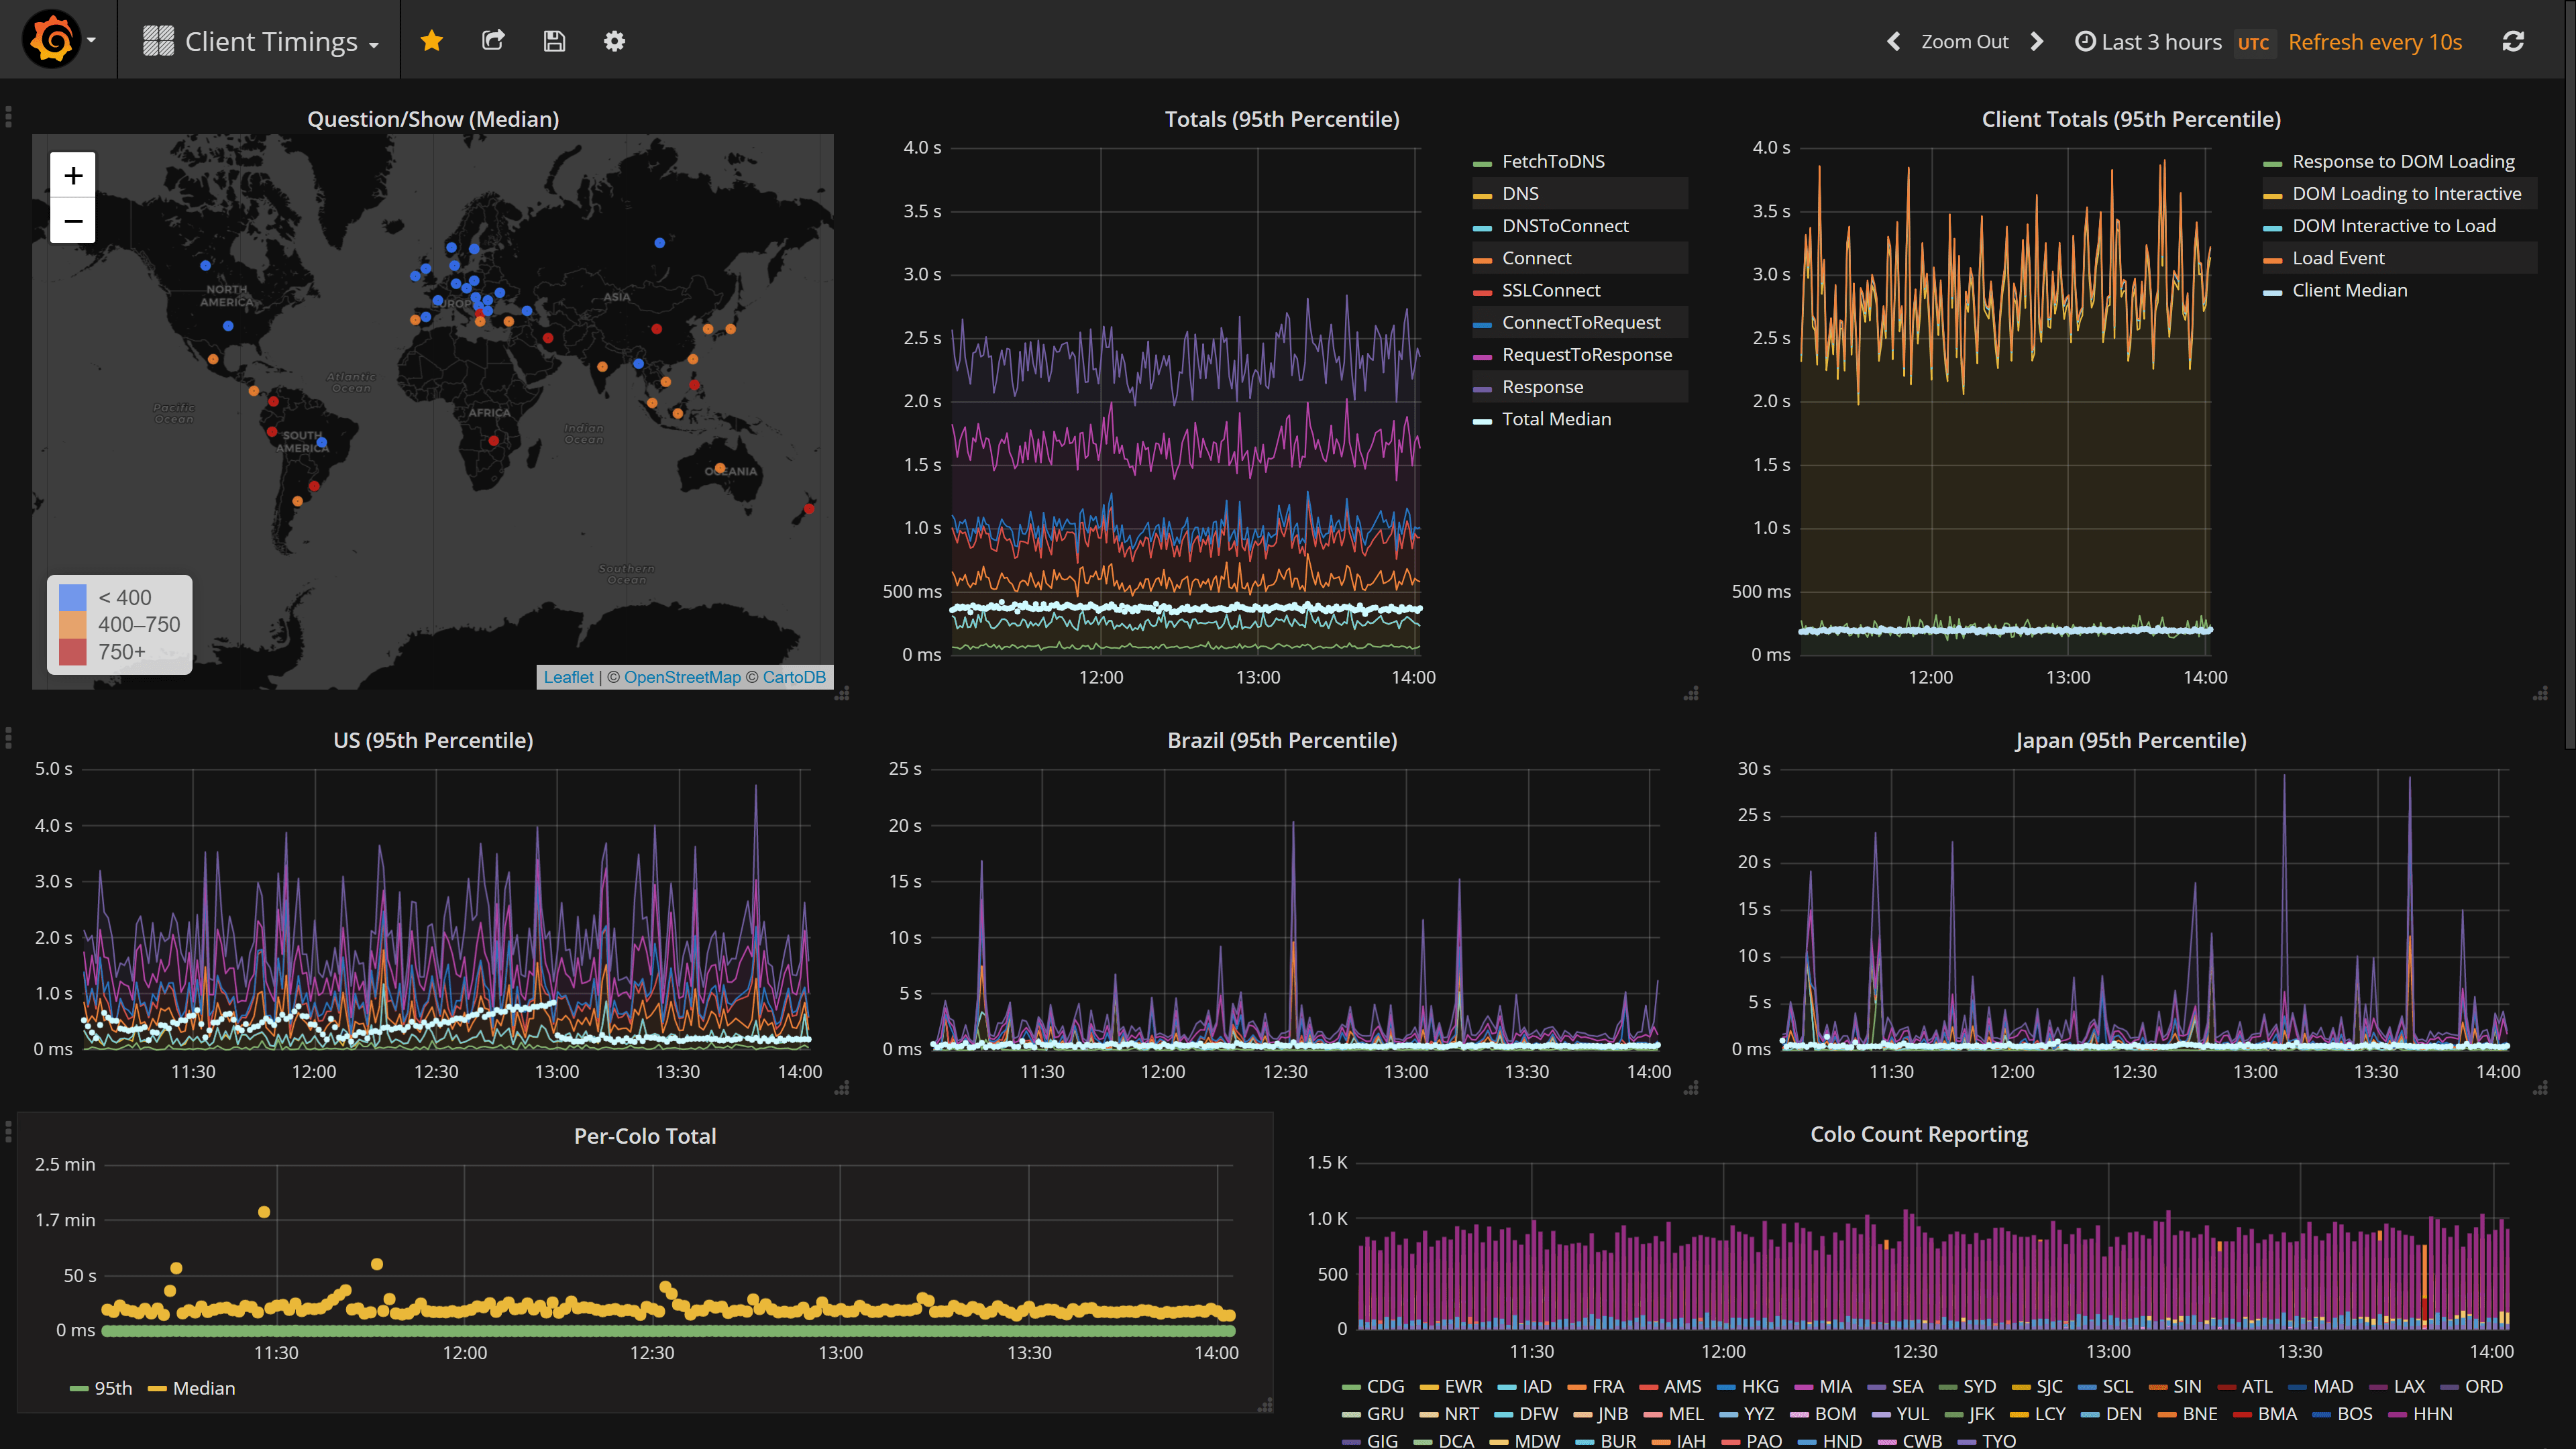
Okay, so now we have some data. If we take that for 5% of traffic, send it to a server, plop it in a giant clustered columnstore in SQL and send some metrics to Bosun along the way, we have something useful. We can test before and after configs, looking at the data. We can also keep an eye on current traffic and look for problems. We use Grafana for the last part, and it looks like this:
Note: that’s a 95% percentile view, the median total render time is the white dots towards the bottom (under 500ms most days).
MiniProfiler
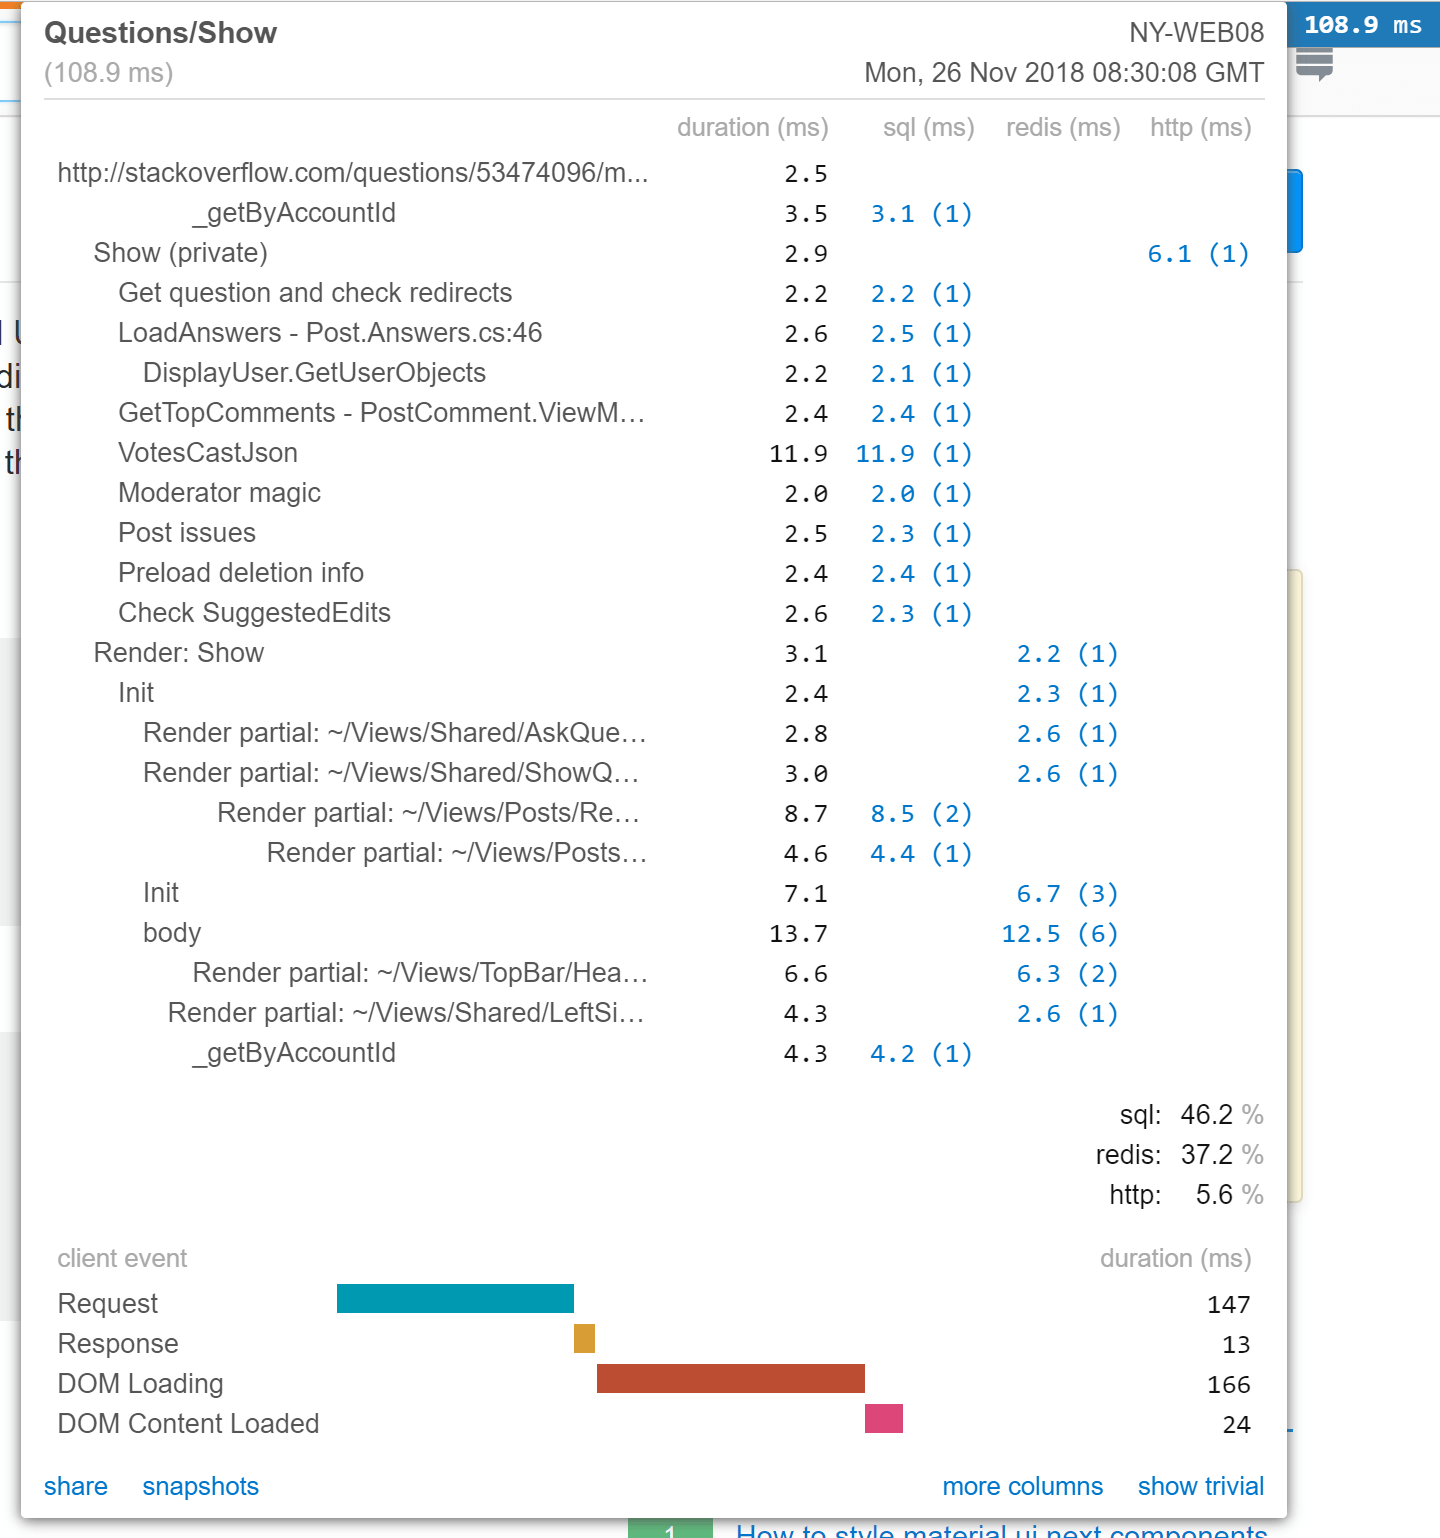
Sometimes the data you want to capture is more specific and detailed than the scenarios above. In our case, we decided almost a decade ago that we wanted to see how long a webpage takes to render in the corner of every single page view. Equally important to monitoring anything is looking at it. Making it visible on every single page you look at is a good way of making that happen. And thus, MiniProfiler was born. It comes in a few flavors (the projects vary a bit): .NET, Ruby, Go, and Node.js. We’re looking at the .NET version I maintain here:
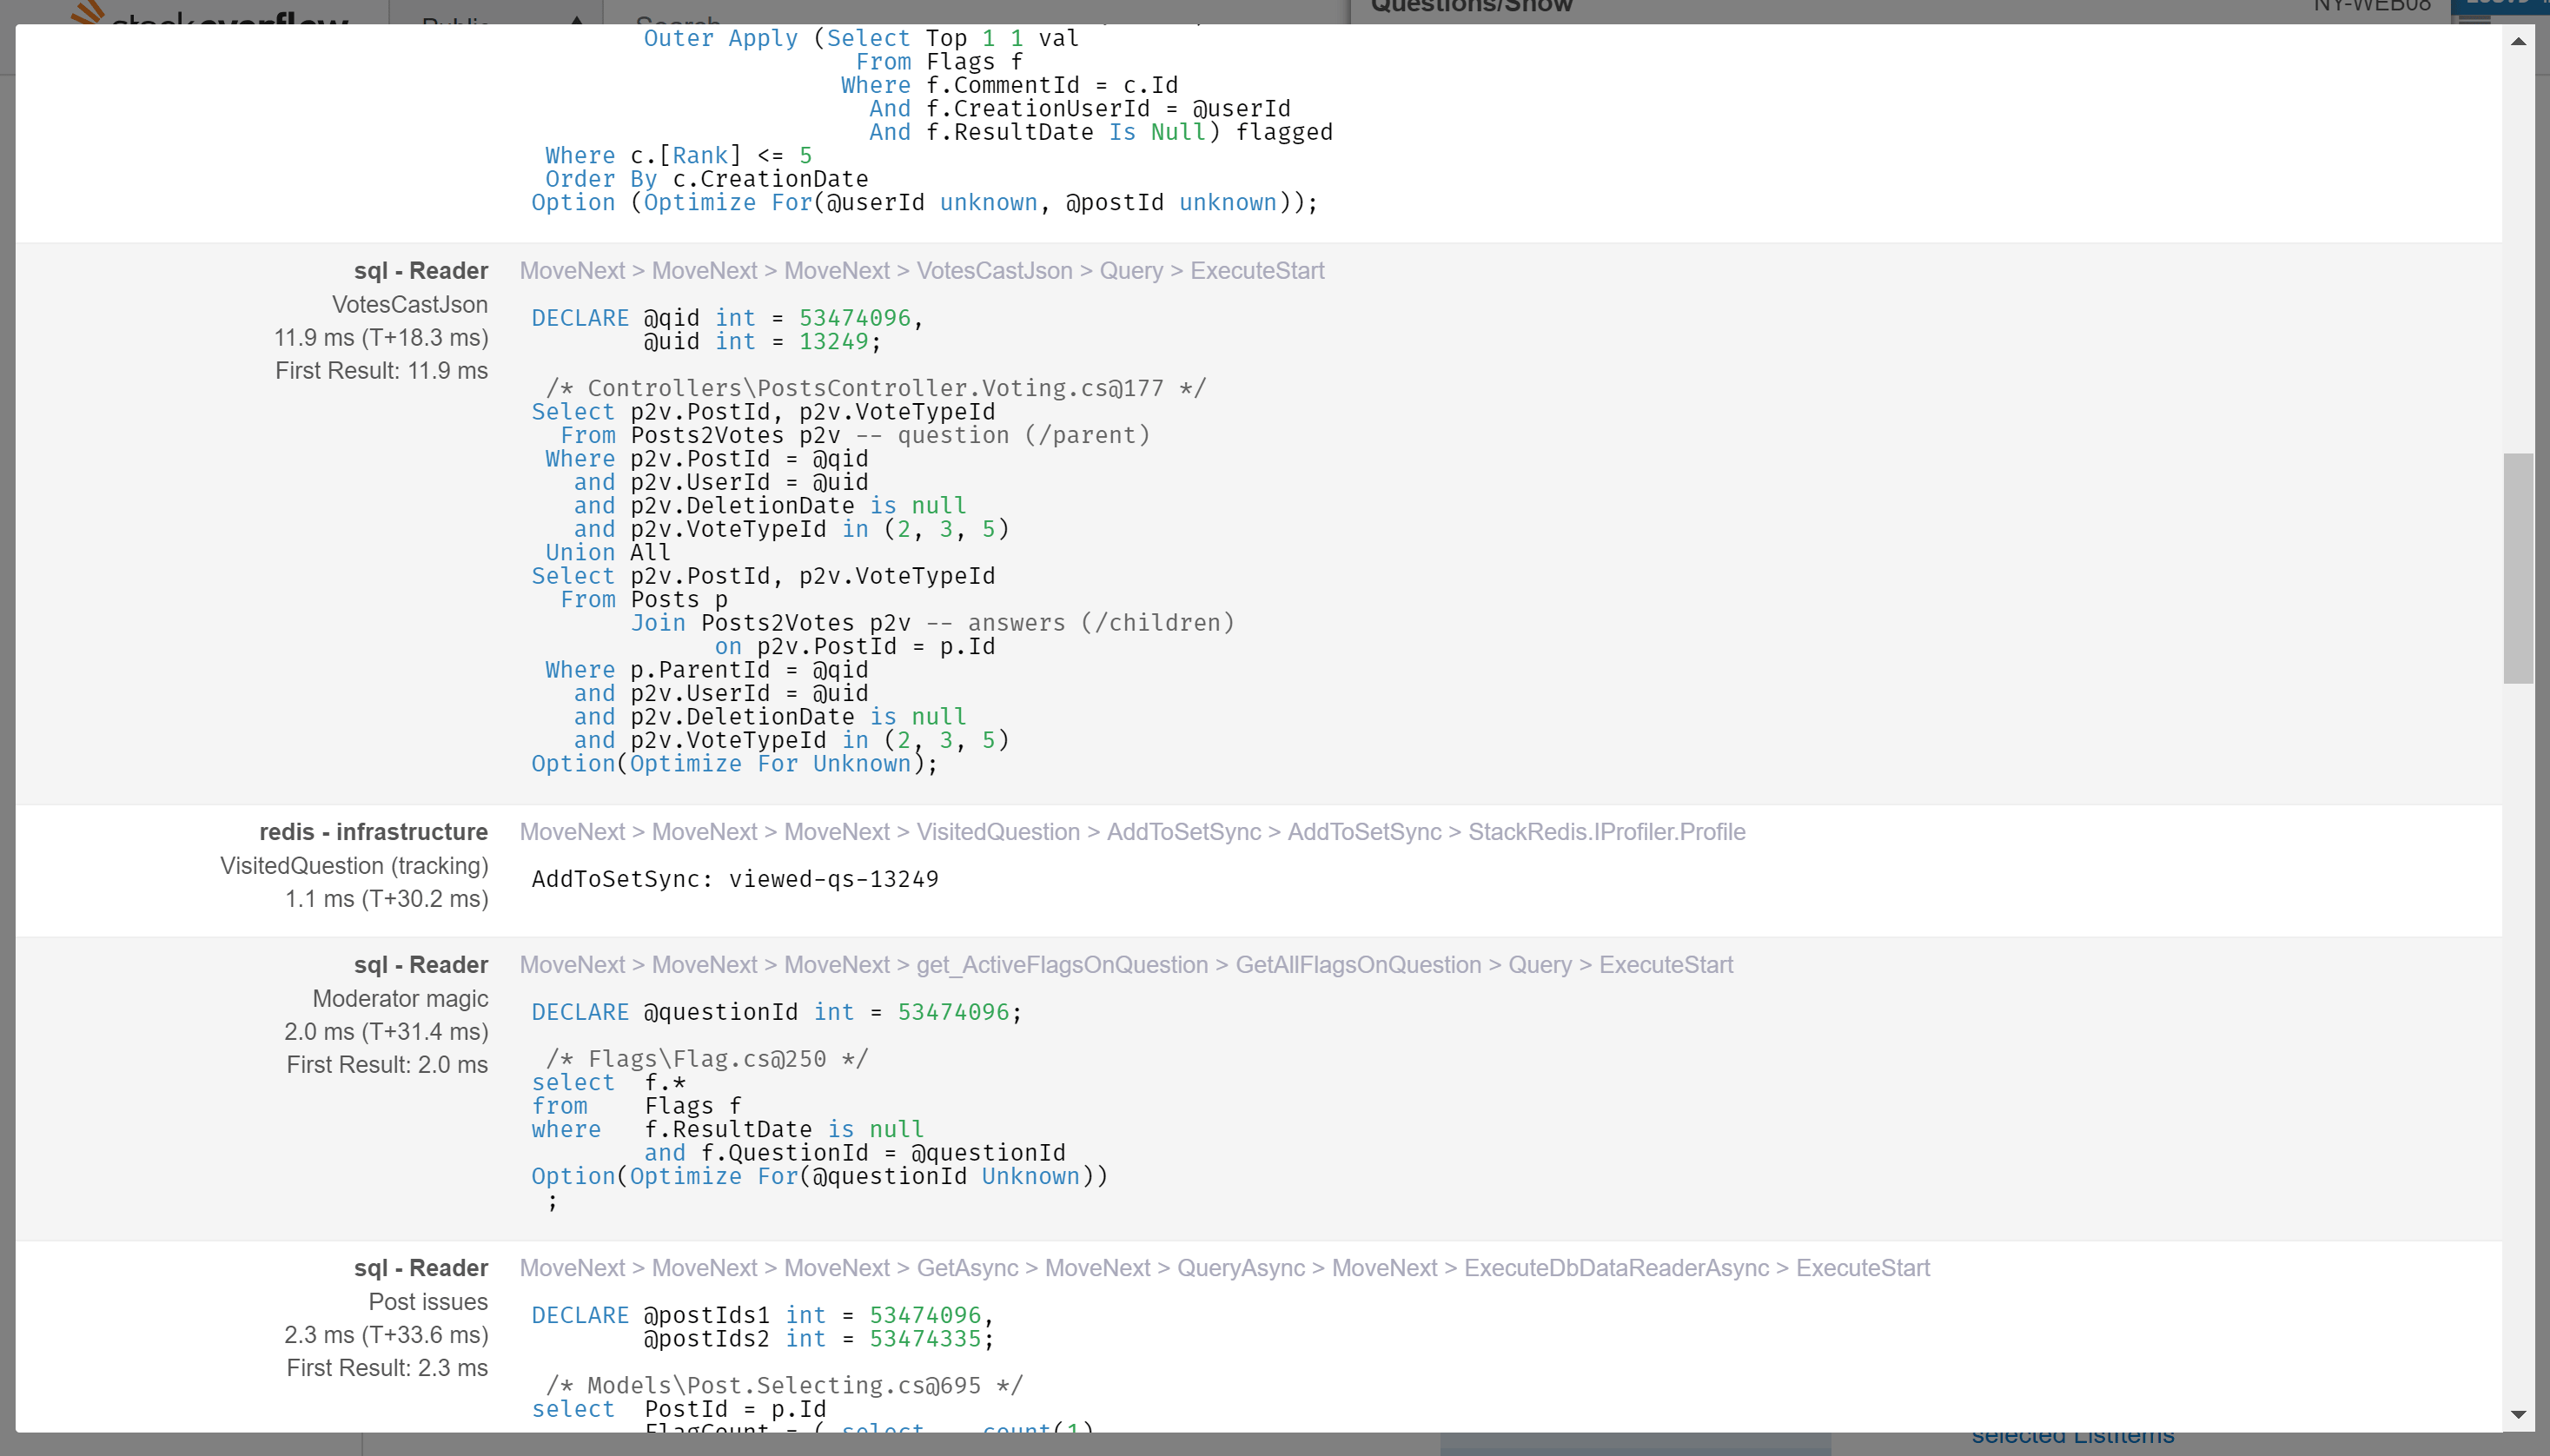
The number is all you see by default, but you can expand it to see a breakdown of which things took how long, in tree form. The commands that are linked there are also viewable, so you can quickly see the SQL or Elastic query that ran, or the HTTP call made, or the Redis key fetched, etc. Here’s what that looks like:
Note: If you’re thinking, that’s way longer than we say our question renders take on average (or even 99th percentile), yes, it is. That’s because I’m a moderator here and we load a lot more stuff for moderators.
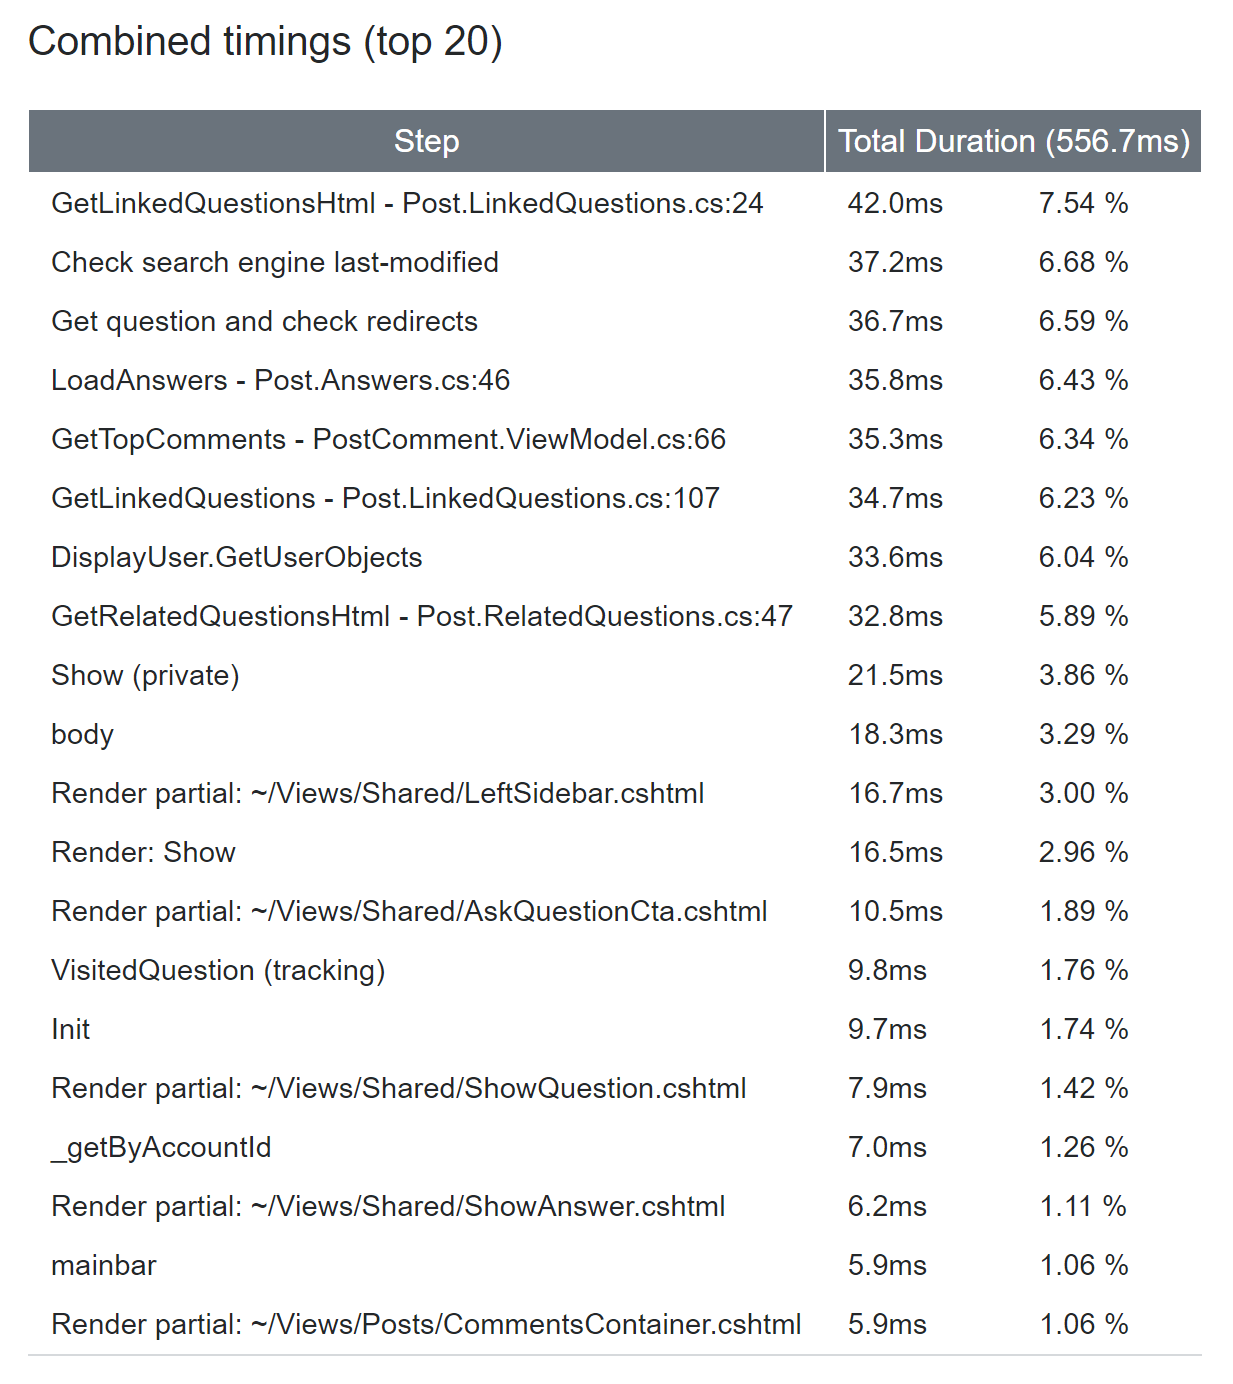
Since MiniProfiler has minimal overhead, we can run it on every request. To that end, we keep a sample of profiles per-MVC-route in Redis. For example, we keep the 100 slowest profiles of any route at a given time. This allows us to see what users may be hitting that we aren’t. Or maybe anonymous users use a different query and it’s slow…we need to see that. We can see the routes being slow in Bosun, the hits in HAProxy logs, and the profile snapshots to dig in. All of this without seeing any code at all, that’s a powerful overview combination. MiniProfiler is awesome (like I’m not biased…) but it is also part of a bigger set of tools here.
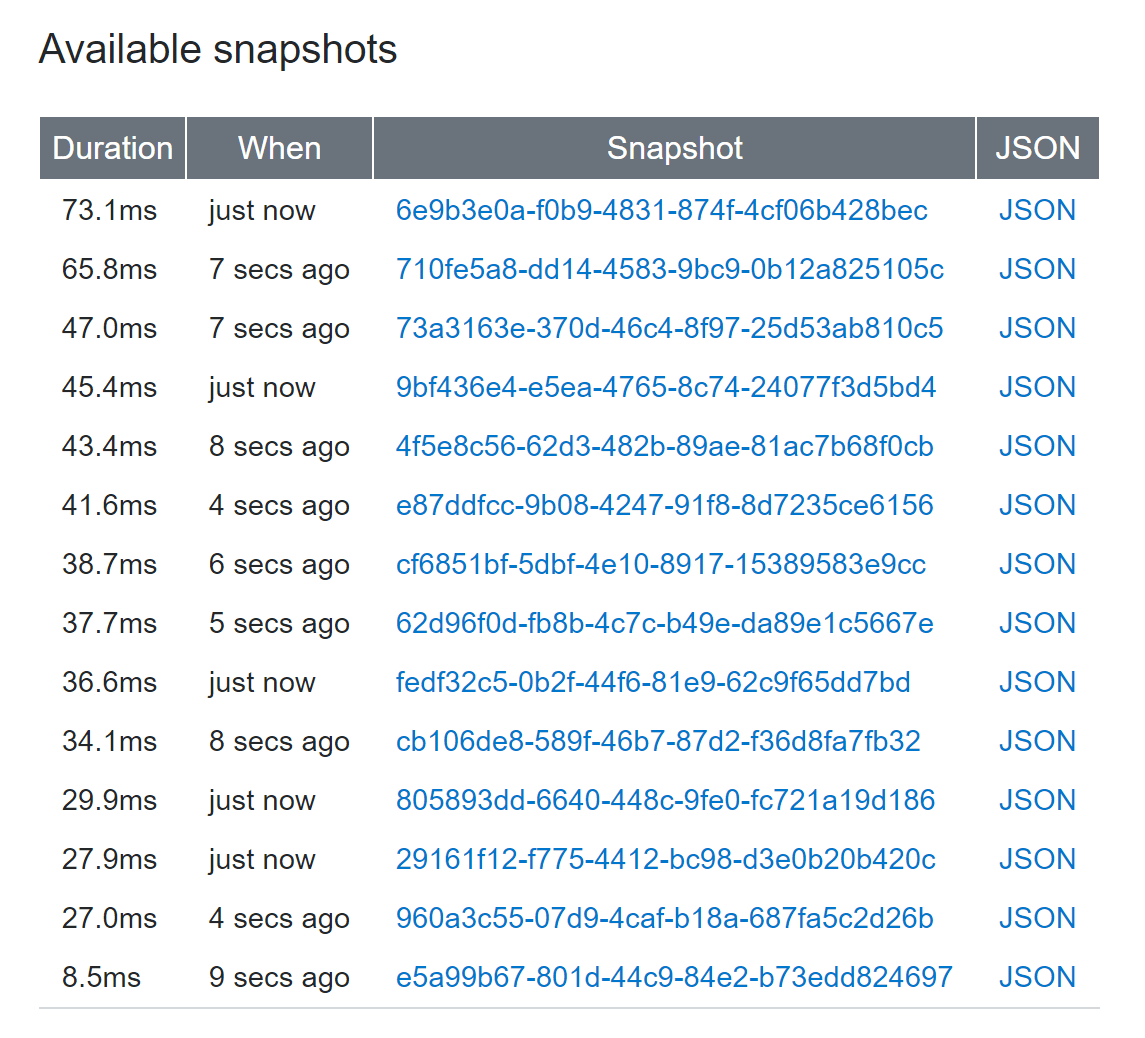
Here’s a view of what those snapshots and aggregate summaries looks like:
| Snapshots | Summary |
|---|---|
 |
 |
…we should probably put an example of that in the repo. I’ll try and get around to it soon.
MiniProfiler was started by Marc Gravell, Sam Saffron, and Jarrod Dixon. I am the primary maintainer since 4.x, but these gentleman are responsible for it existing. We put MiniProfiler in all of our applications.
Note: see those GUIDs in the screenshots? That’s MiniProfiler just generating an ID. We now use that as a “Request ID” and it gets logged in those HAProxy logs and to any exceptions as well. Little things like this help tie the world together and let you correlate things easily.
Opserver
So, what is Opserver?
It’s a web-based dashboard and monitoring tool I started when SQL Server’s built-in monitoring lied to us one day.
About 5 years ago, we had an issue where SQL Server AlwaysOn Availability Groups showed green on the SSMS dashboard (powered by the primary), but the replicas hadn’t seen new data for days.
This was an example of extremely broken monitoring.
What happened was the HADR thread pool exhausted and stopped updating a view that had a state of “all good”.
I’d link you to the Connect item but they just deleted them all.
I’m not bitter.
The design of such isn’t necessarily flawed, but when caching/storing the state of a thing, it needs to have a timestamp.
If it hasn’t been updated in <pick a threshold>, that’s a red alert.
Nothing about the state can be trusted.
Anyway, enter Opserver.
The first thing it did was monitor each SQL node rather than trusting the master.
Since then, I’ve added monitoring for our other systems we wanted in a quick web-based view. We can see all servers (based on Bosun, or Orion, or WMI directly). Here is an overview of where Opserver is today:
Opserver: Primary Dashboard
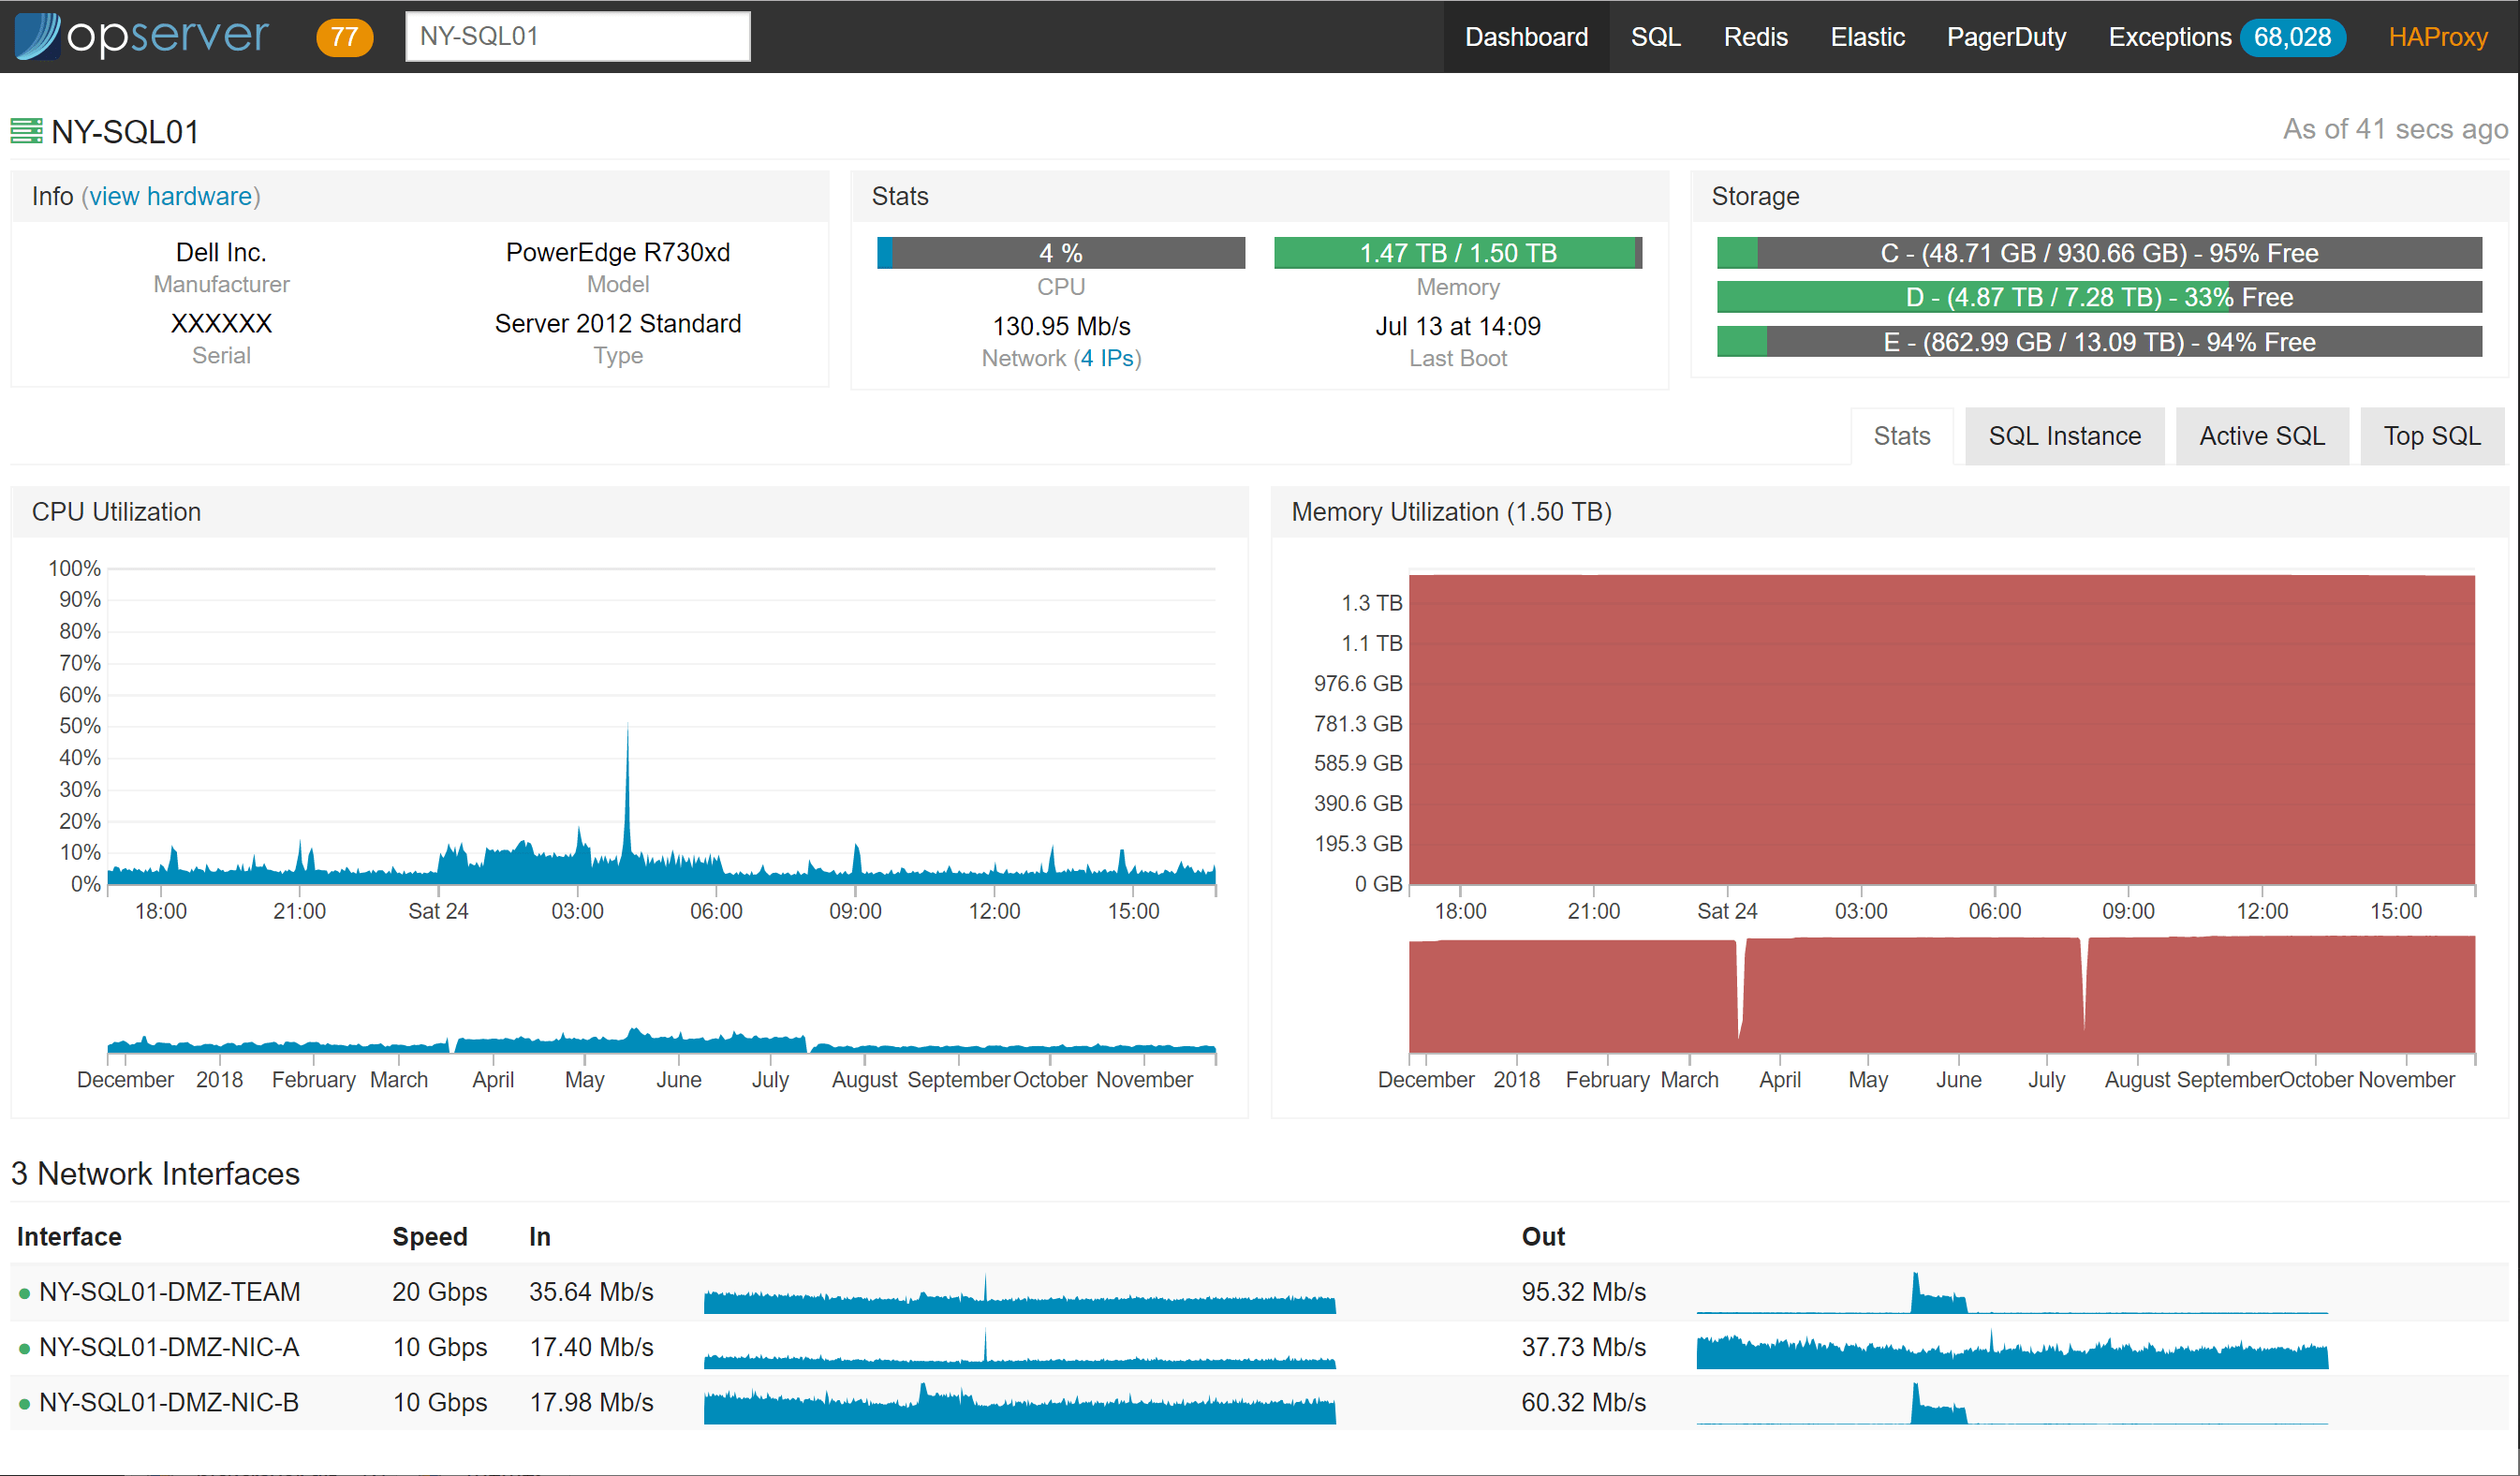
The landing dashboard is a server list showing an overview of what’s up. Users can search by name, service tag, IP address, VM host, etc. You can also drill down to all-time history graphs for CPU, memory, and network on each node.
Within each node looks like this:
If using Bosun and running Dell servers, we’ve added hardware metadata like this:
Opserver: SQL Server
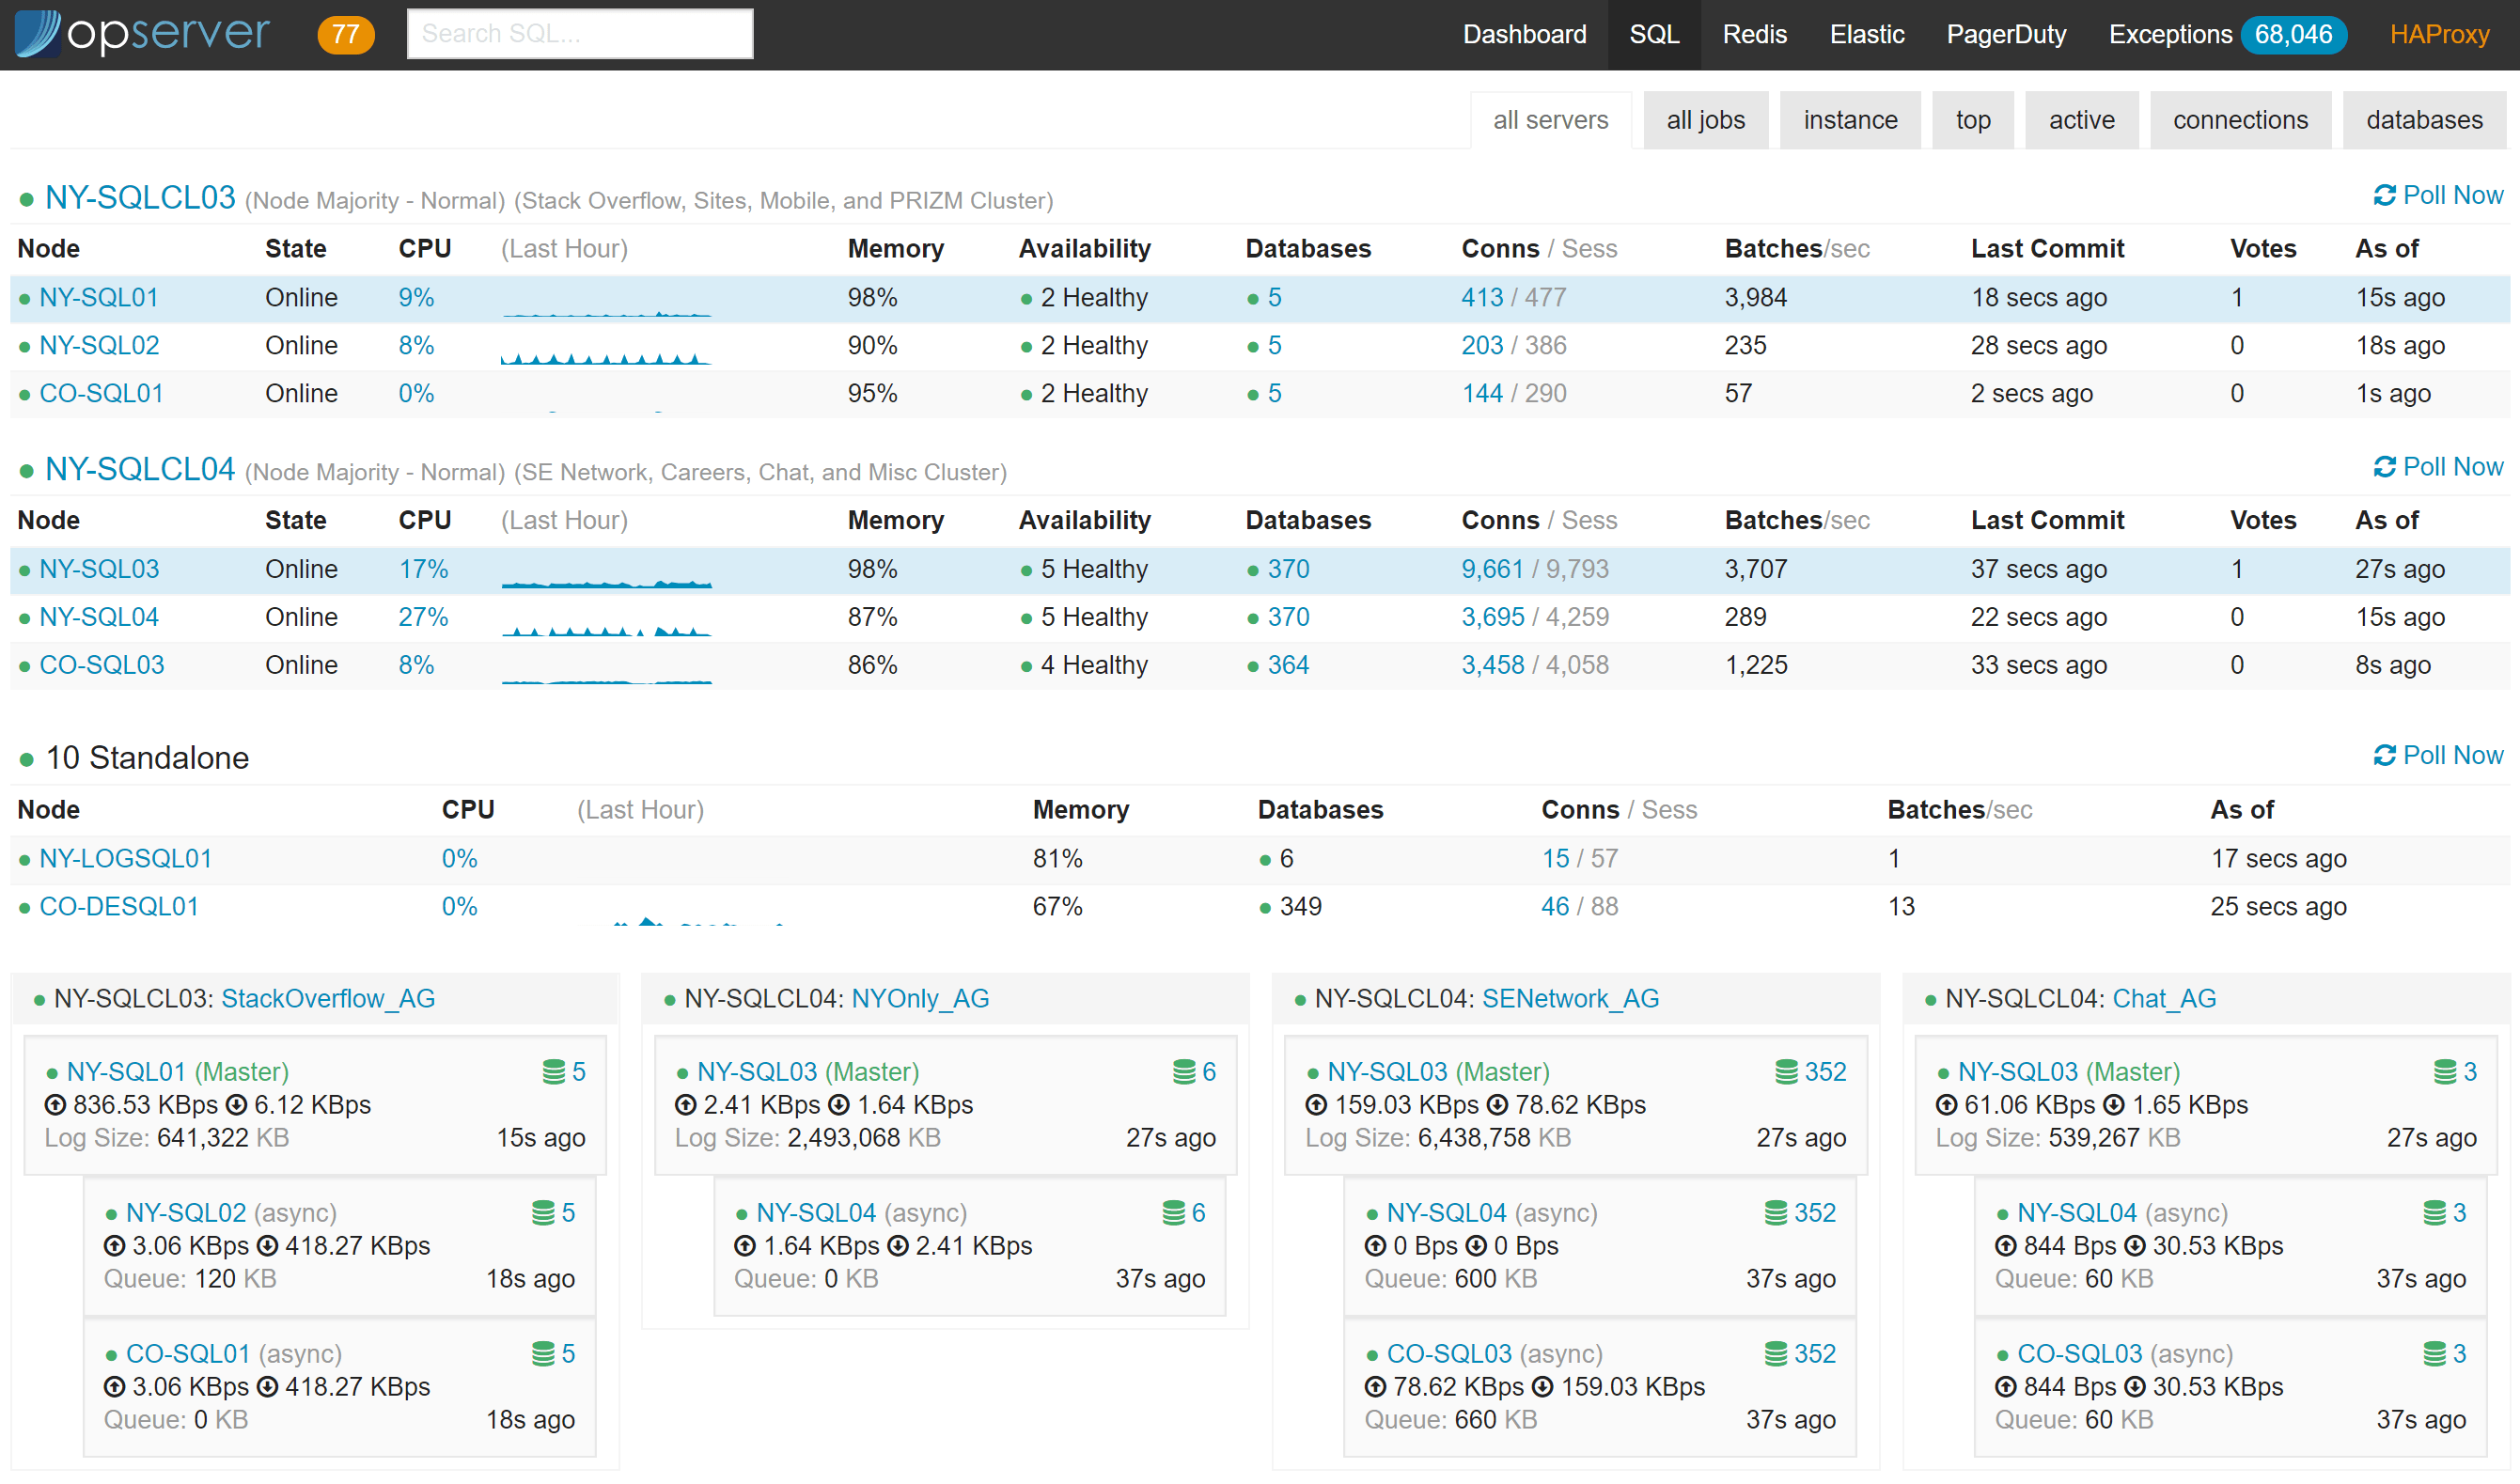
In the SQL dashboard, we can see server status and how the availability groups are doing. We can see how much activity each node has and which one is primary (in blue) at any given time. The bottom section is AlwaysOn Availability Groups, we can see who’s primary for each, how far behind replication is, and how much queues are backed up. If things go south and a replica is unhealthy, some more indicators pop in like which databases are having issues and the free disk space on the primary for all drives involved in T-logs (since they will start growing if replication remains down):
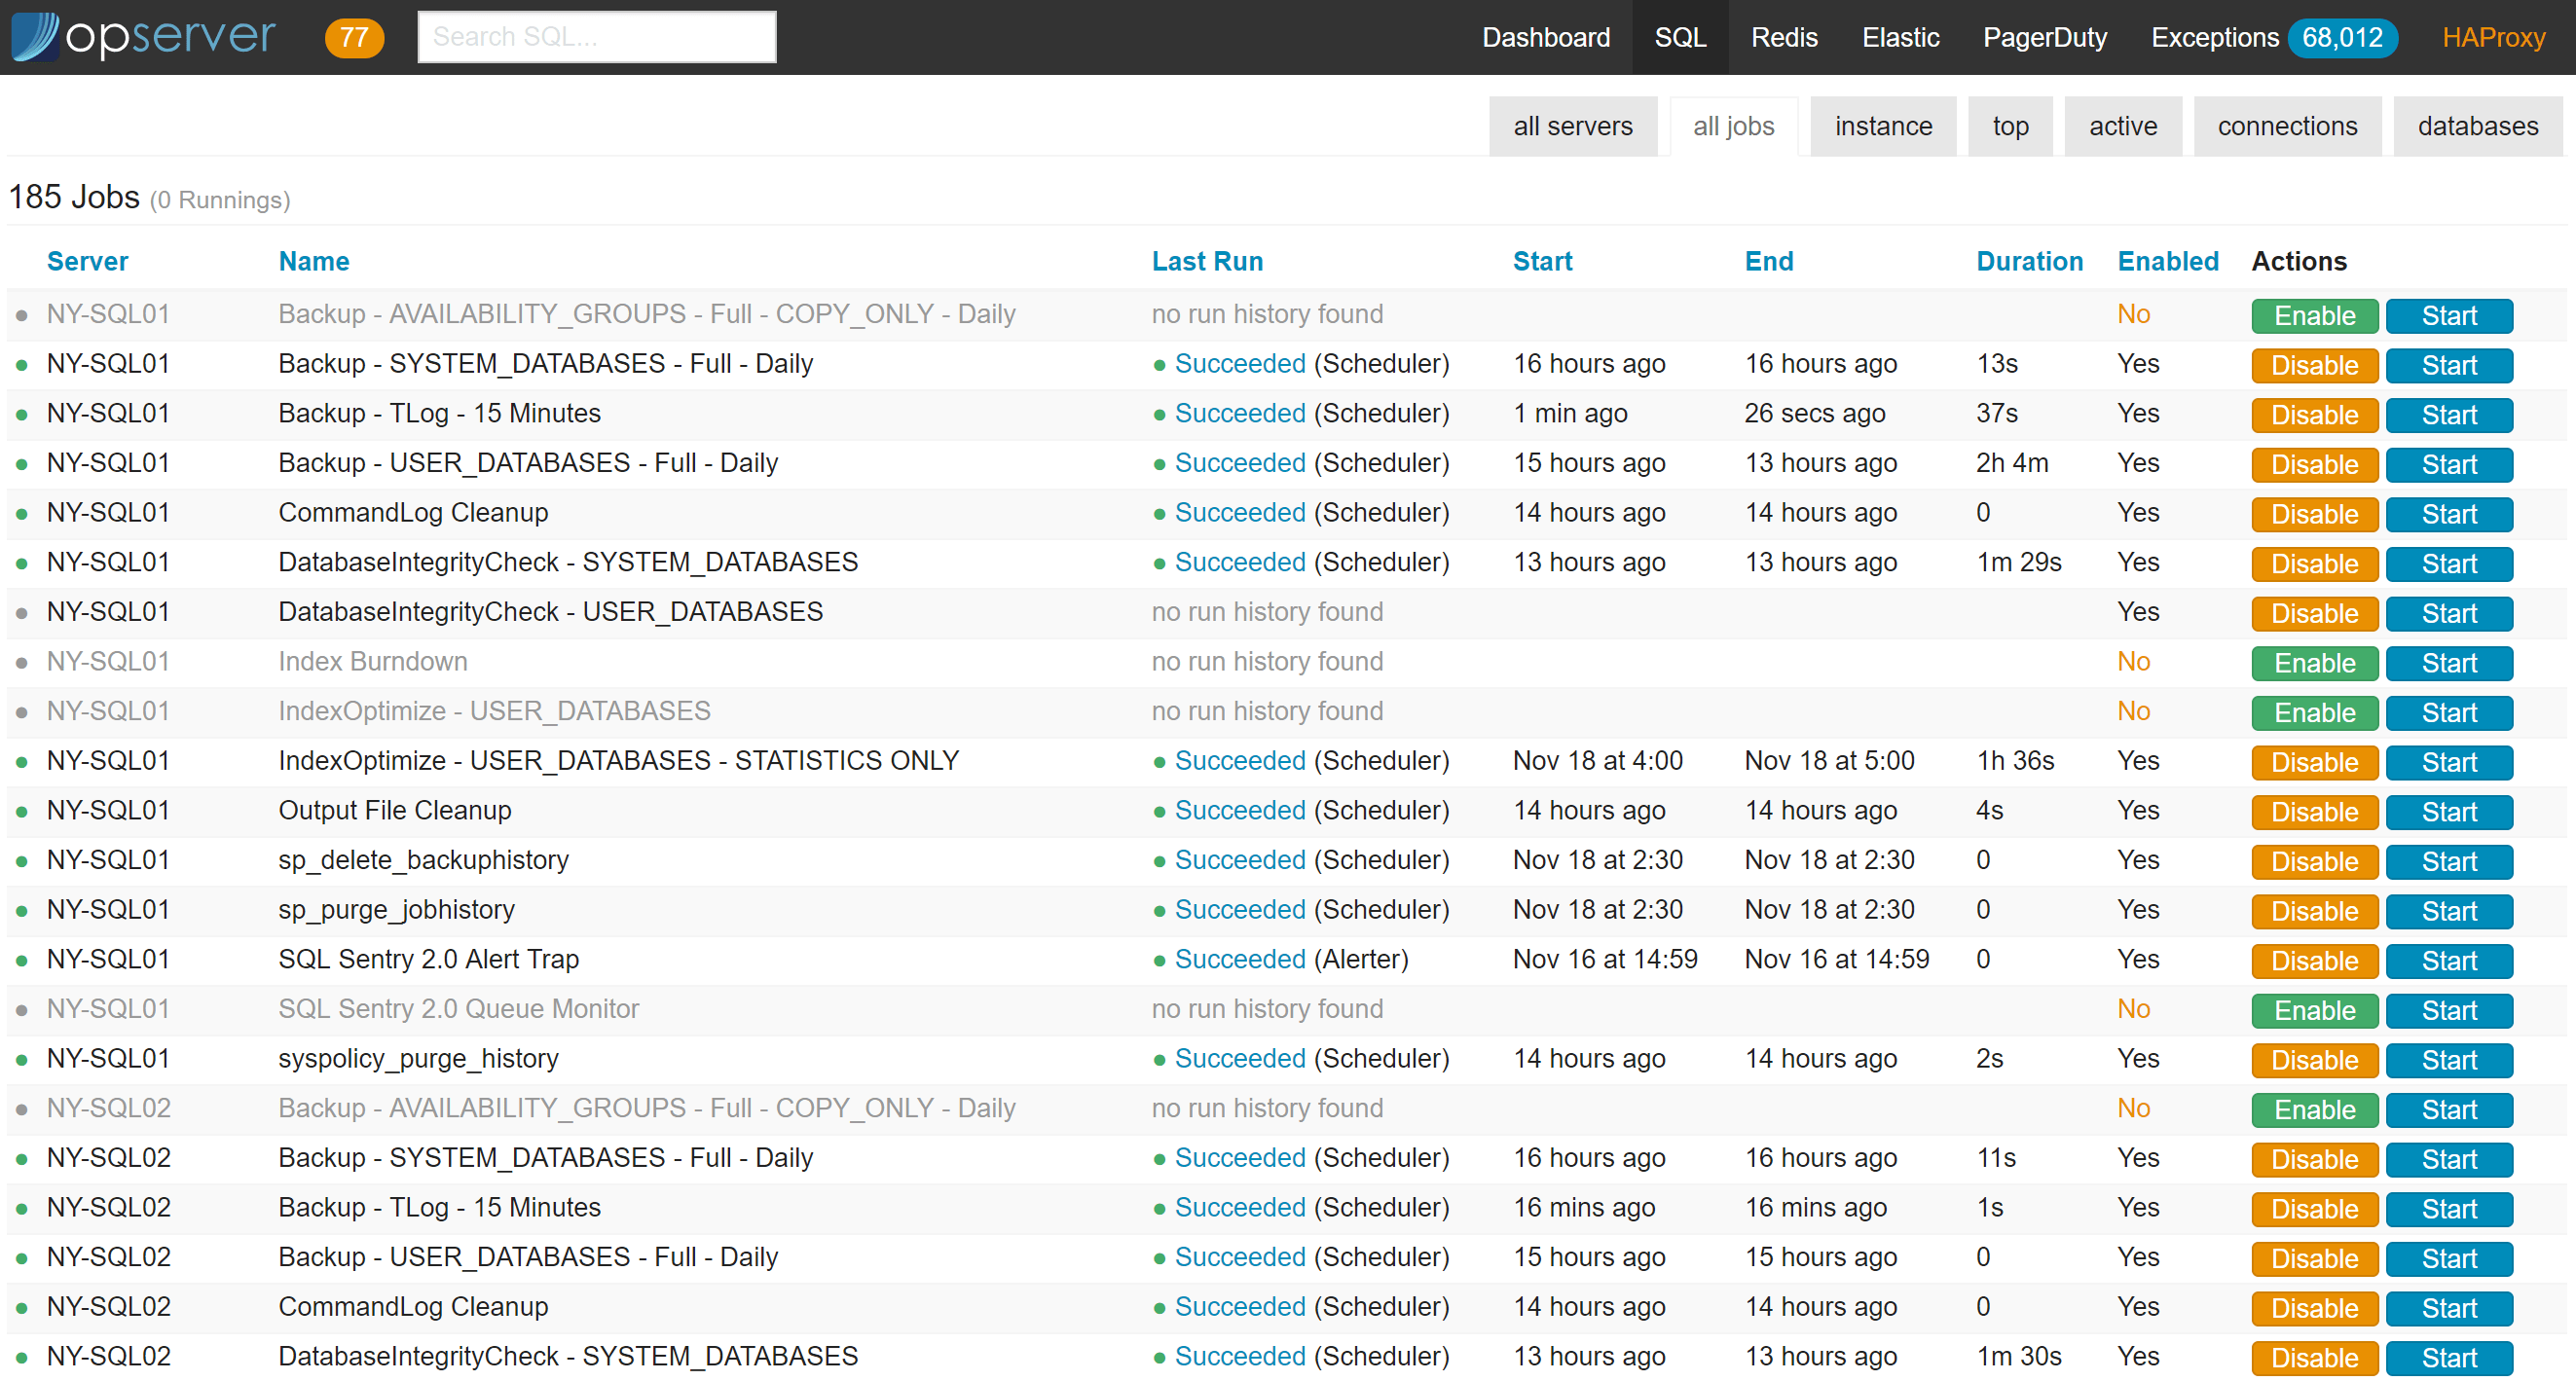
There’s also a top-level all-jobs view for quick monitoring and enabling/disabling:
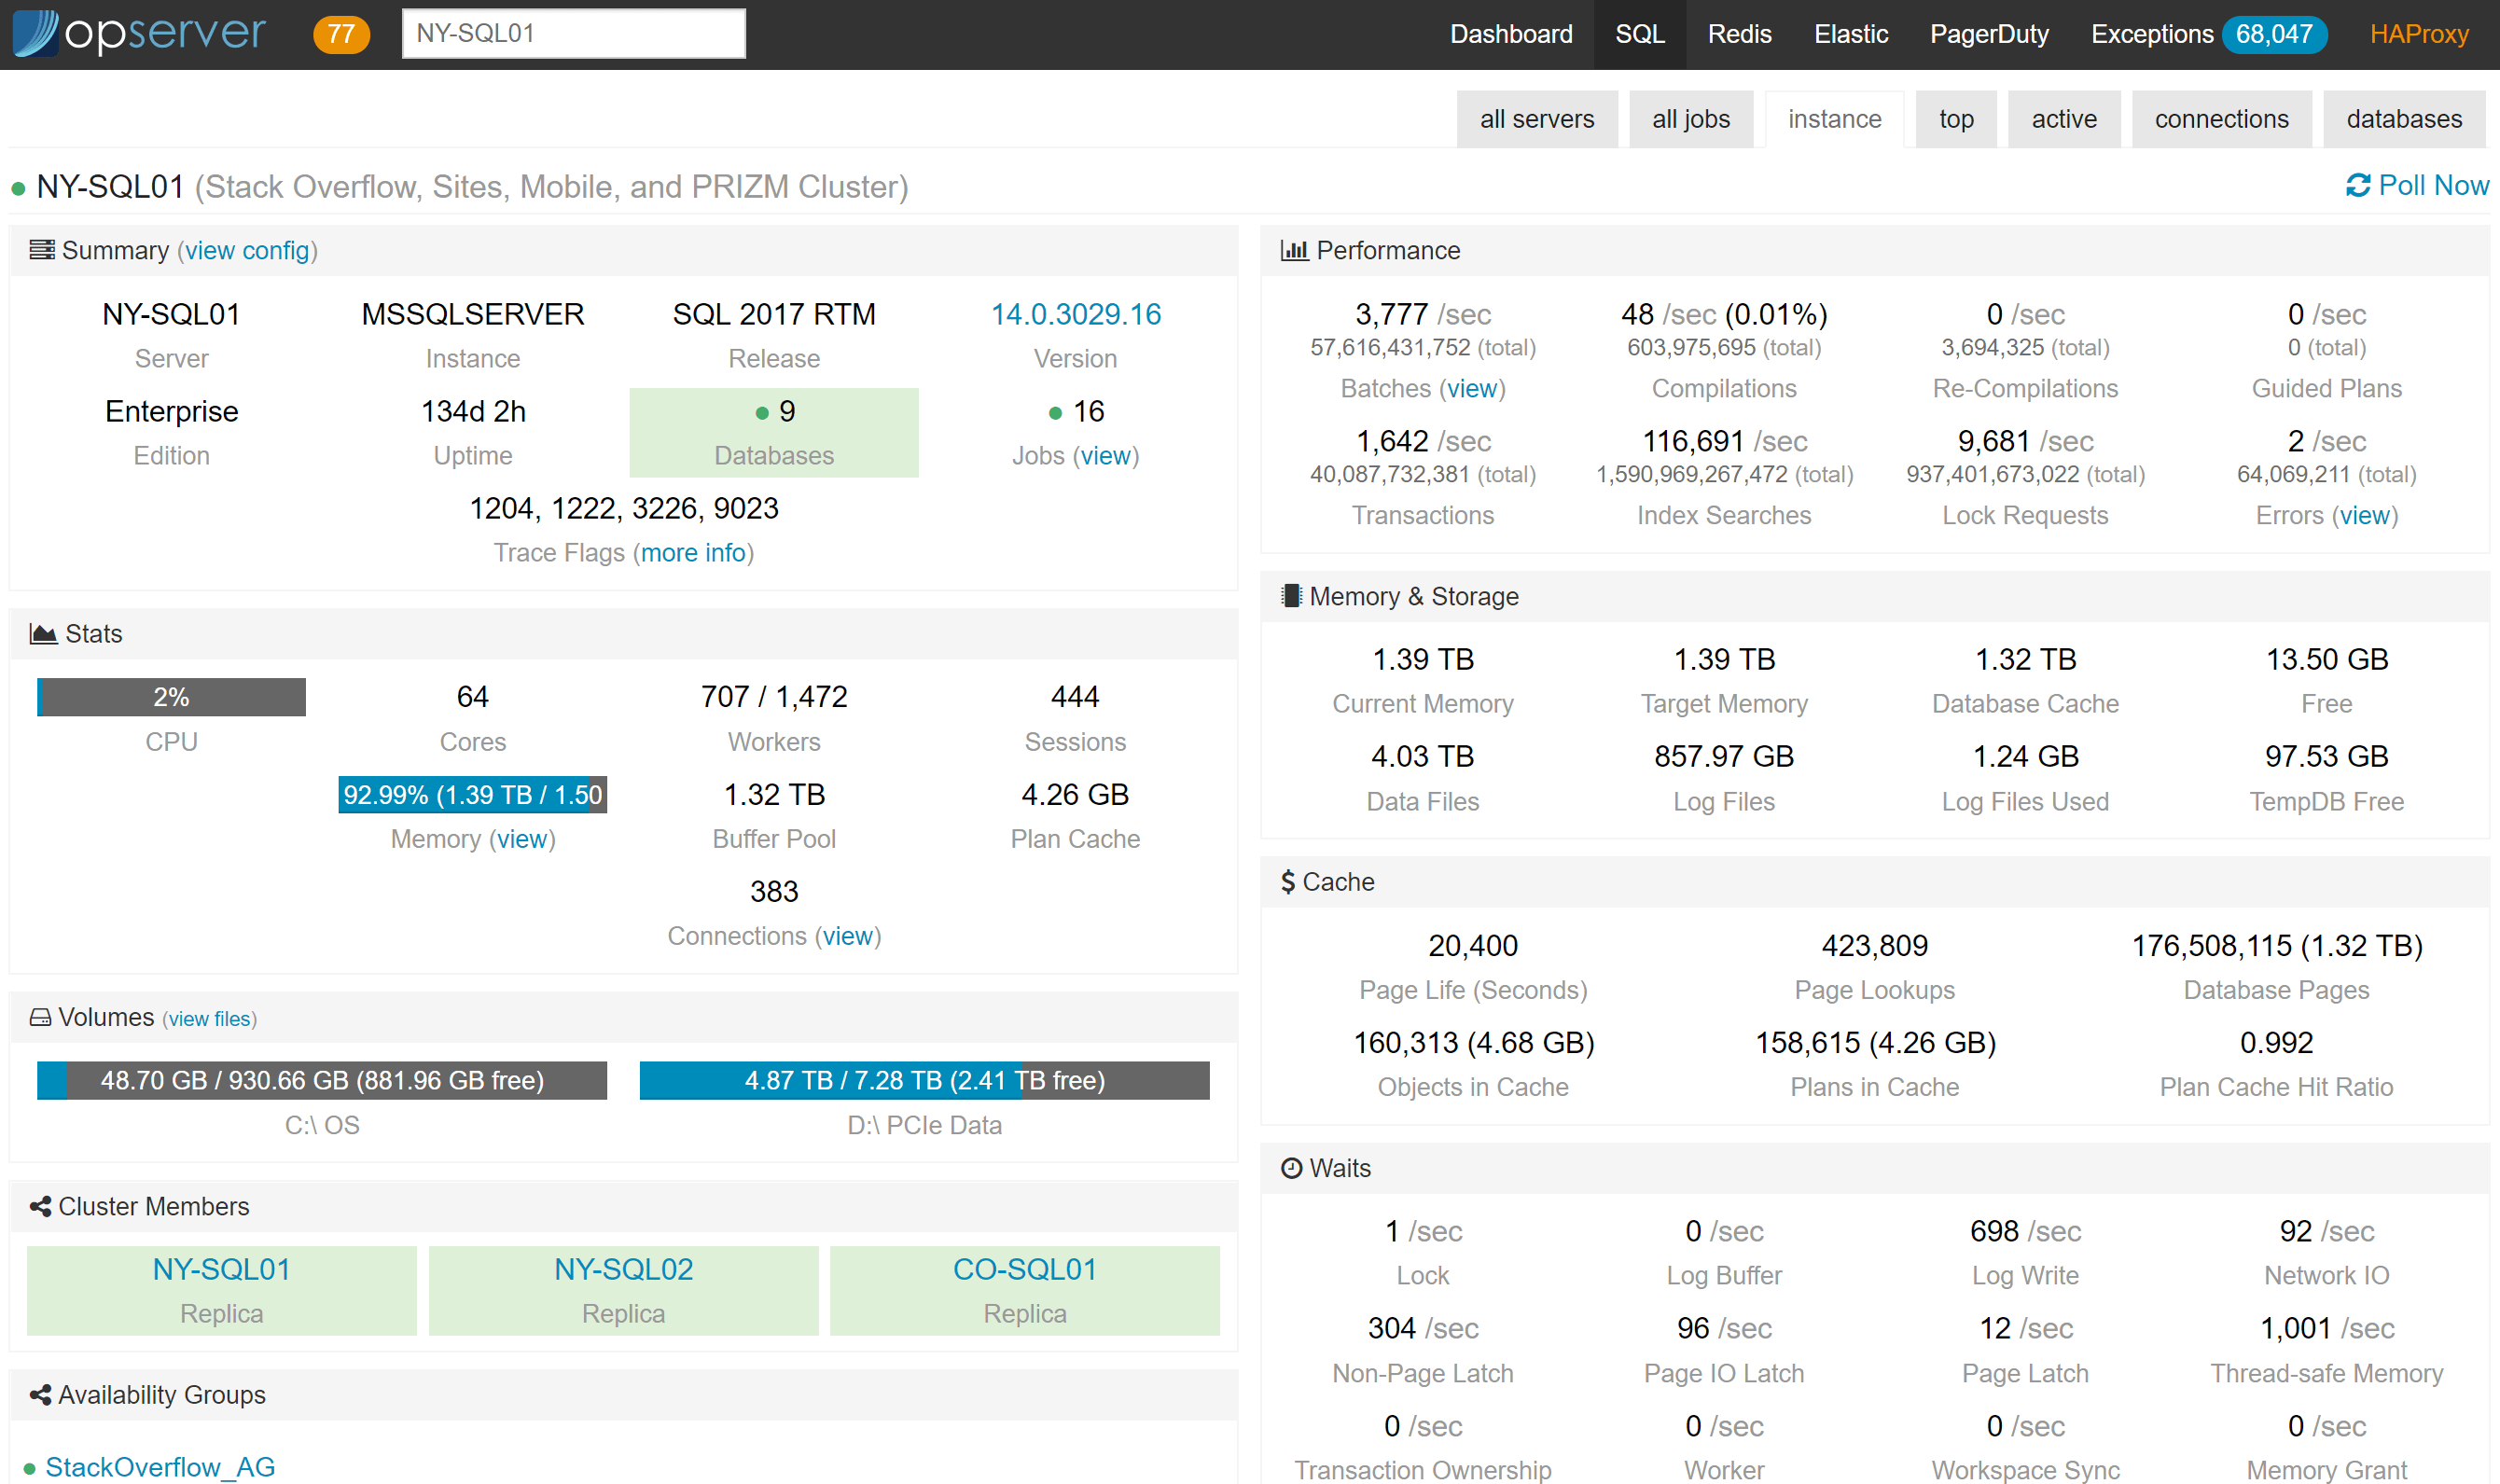
And in the per-instance view we can see the stats about the server, caches, etc., that we’ve found relevant over time.
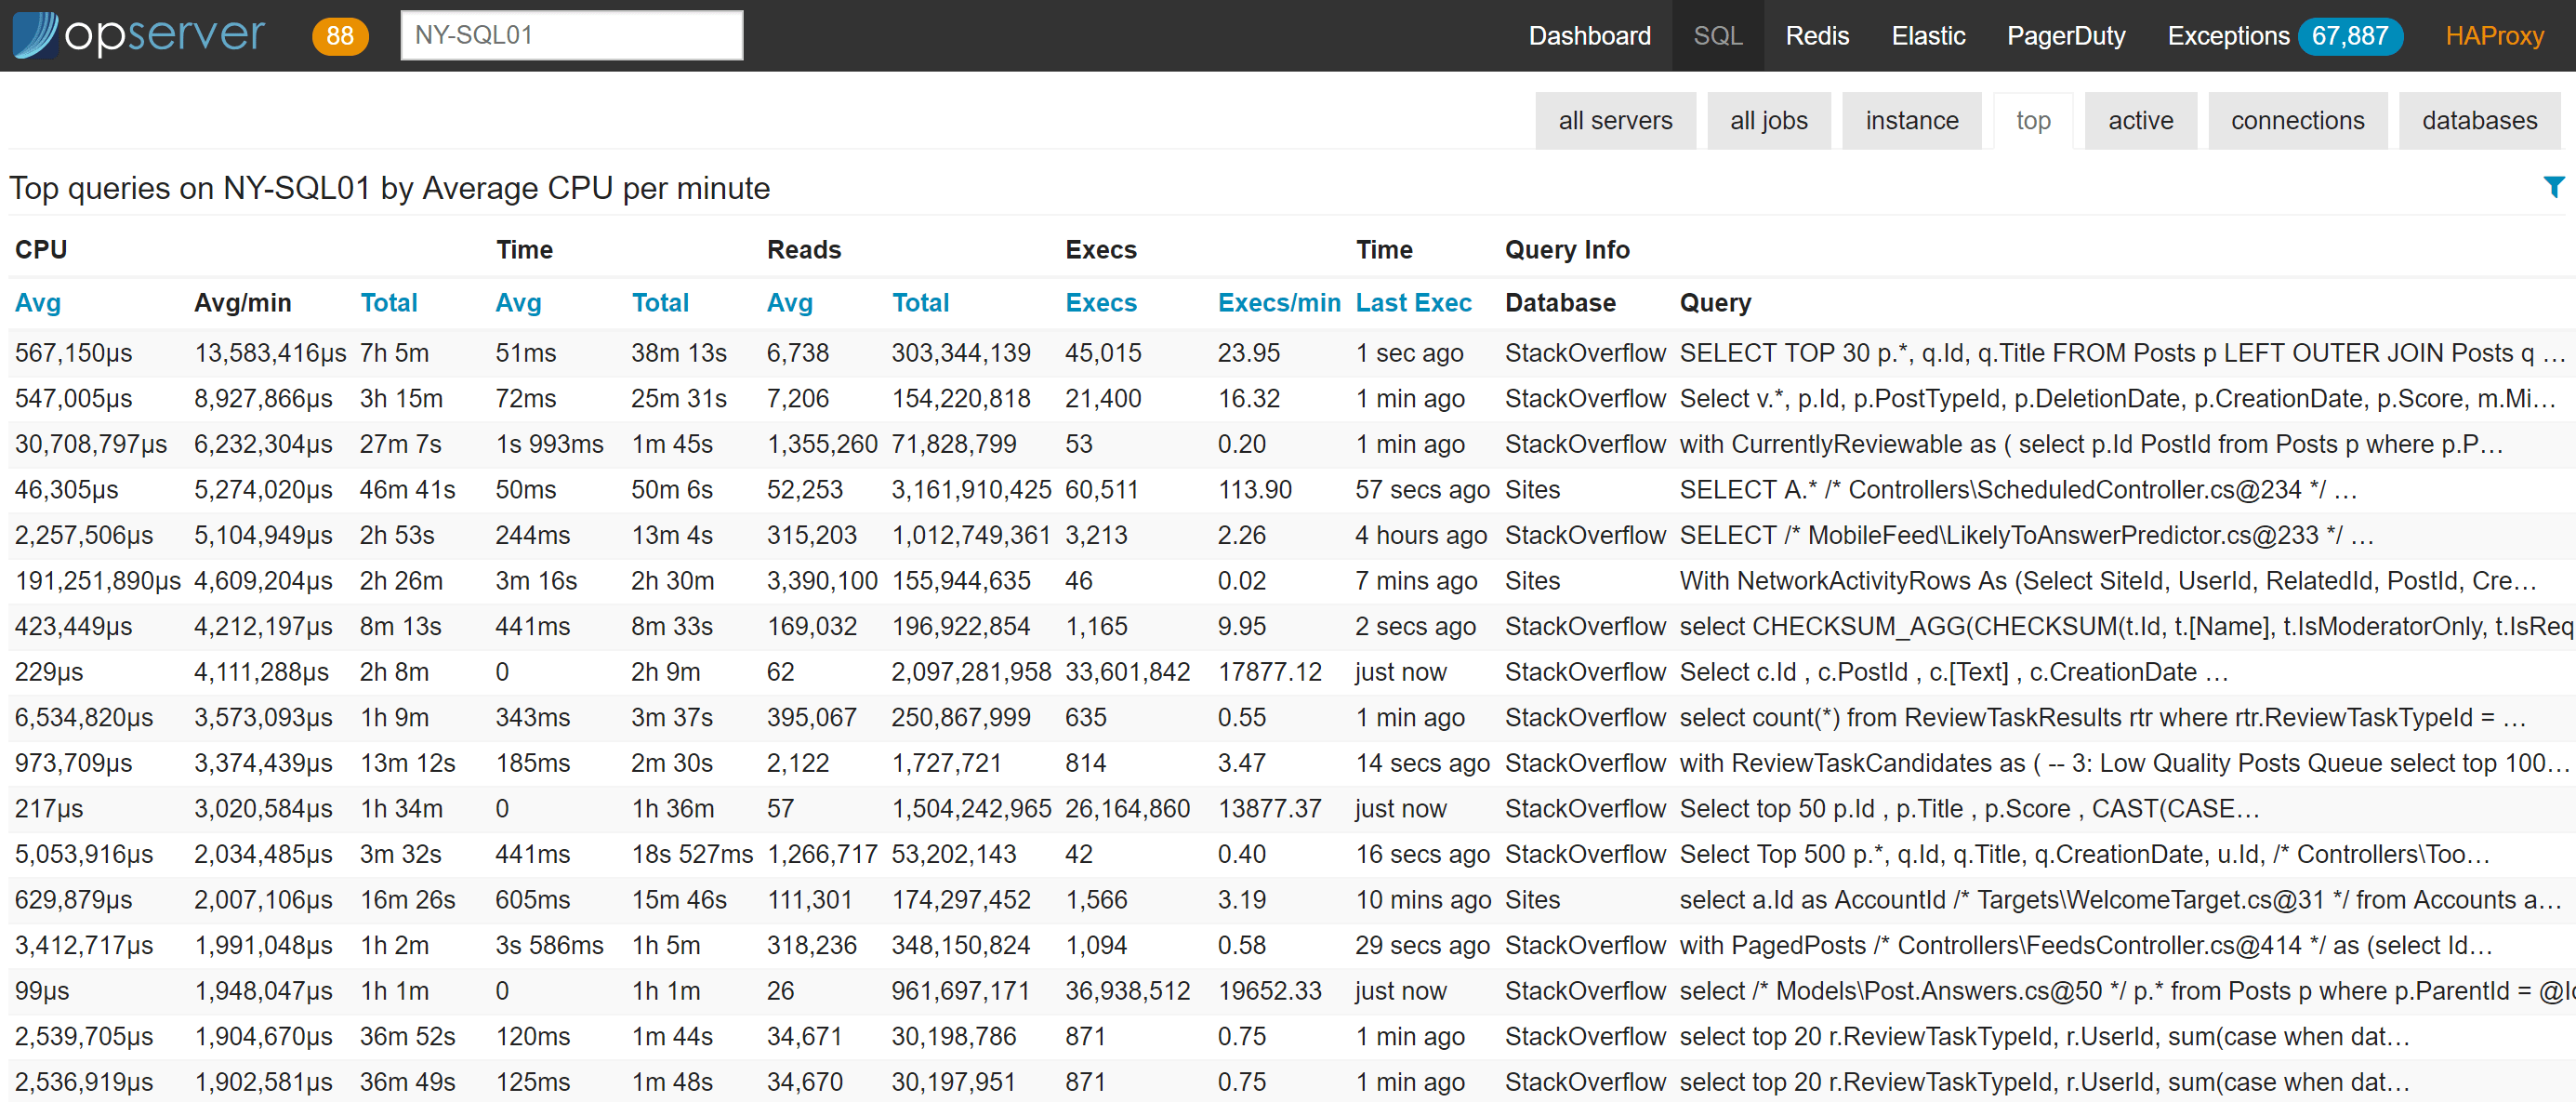
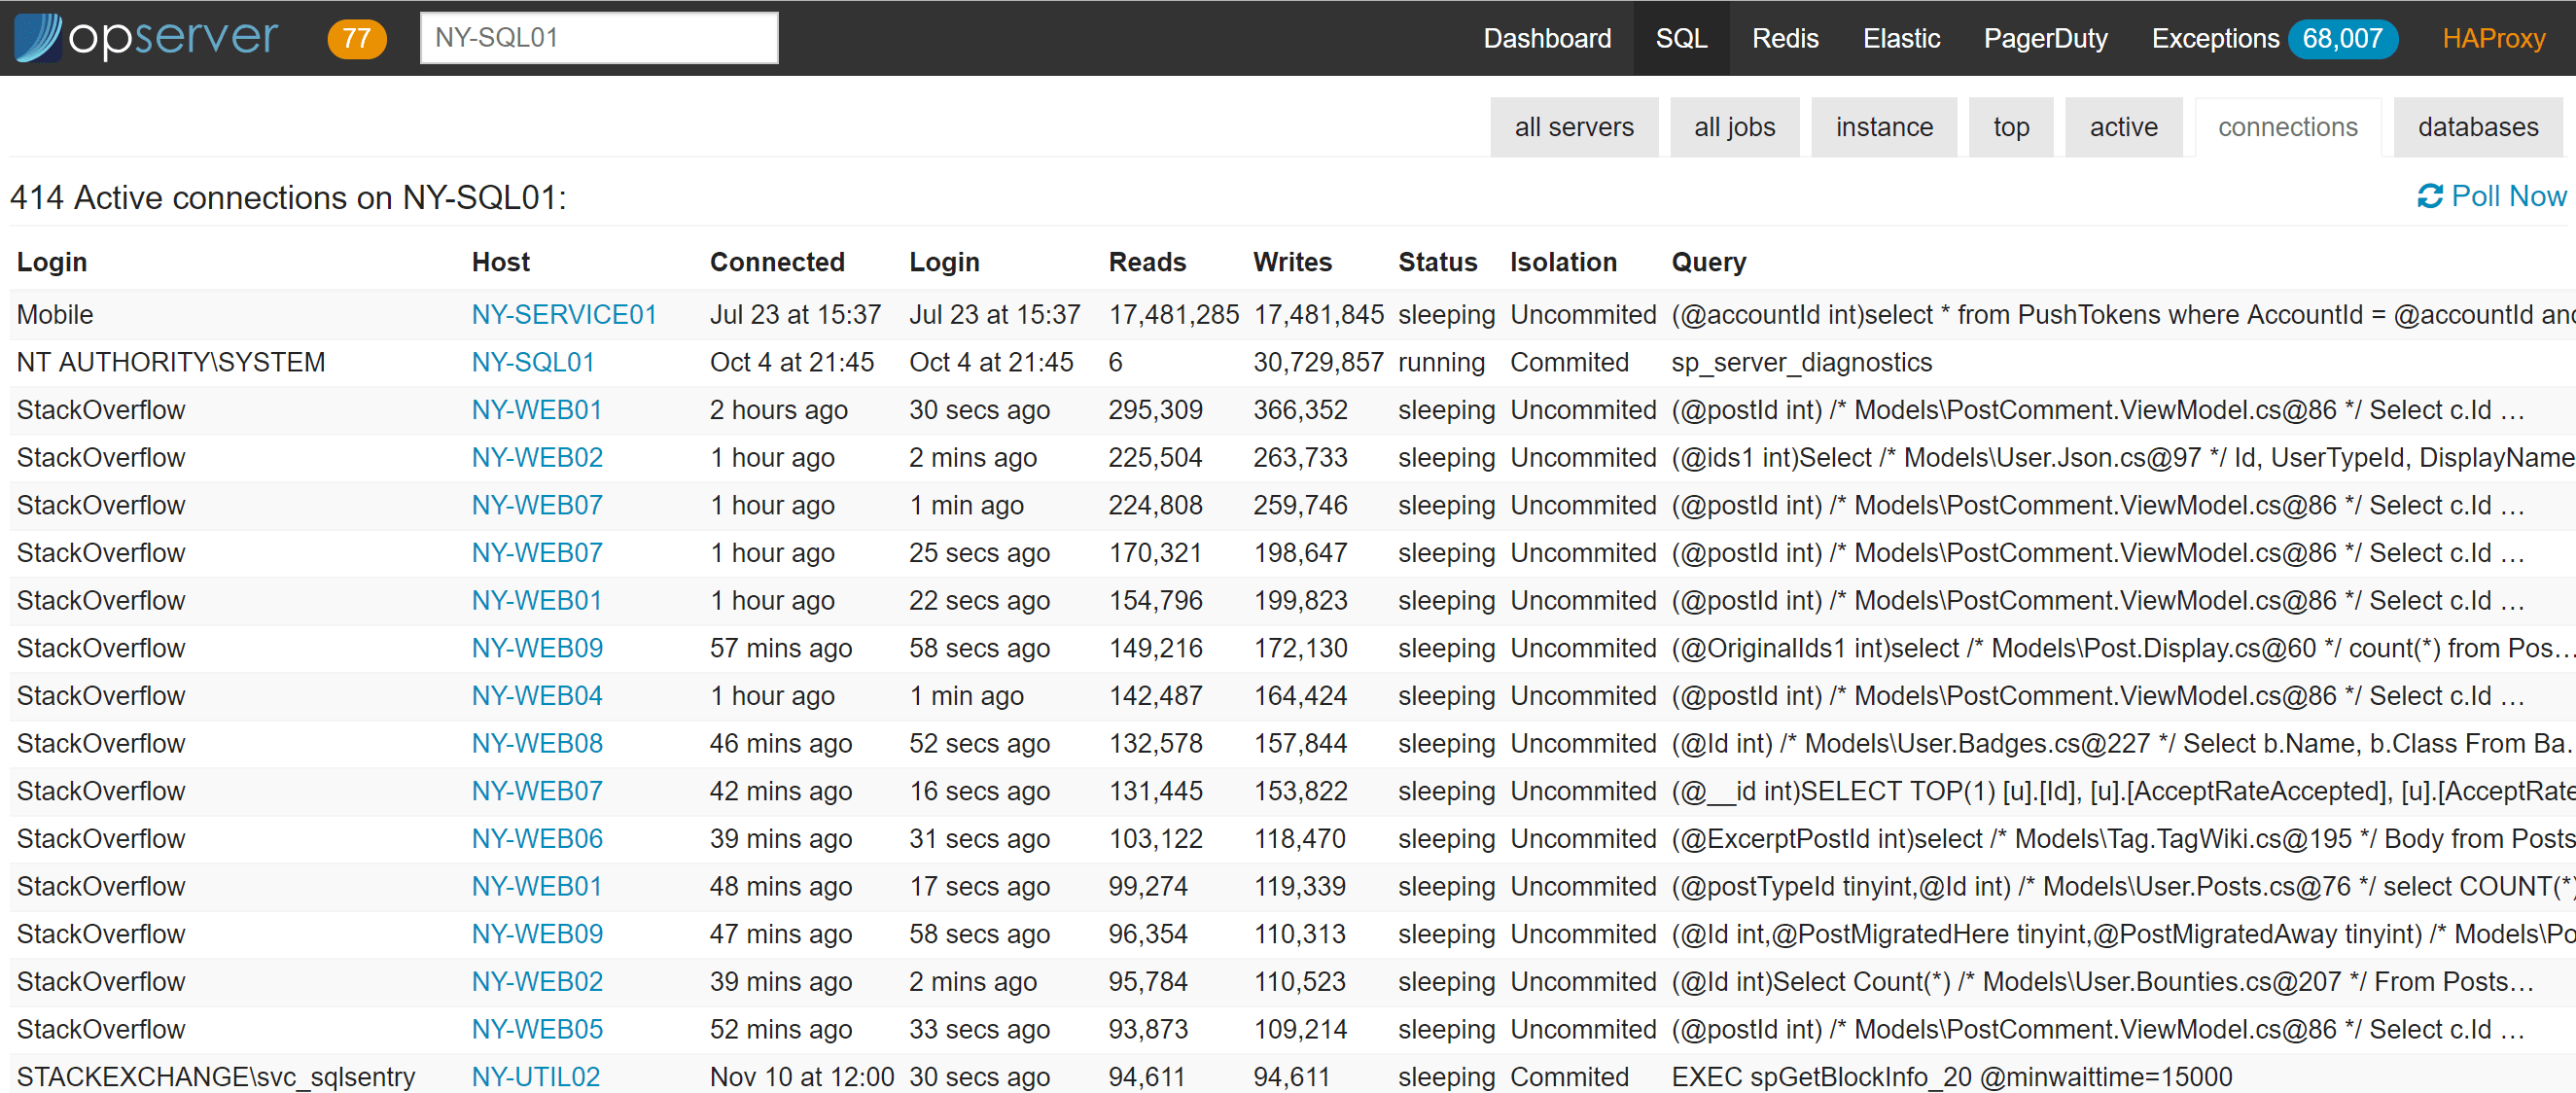
For each instance, we also report top queries (based on plan cache, not query store yet), active-right now queries (based on sp_whoisactive), connections, and database info.
…and if you want to drill down into a top query, it looks like this:
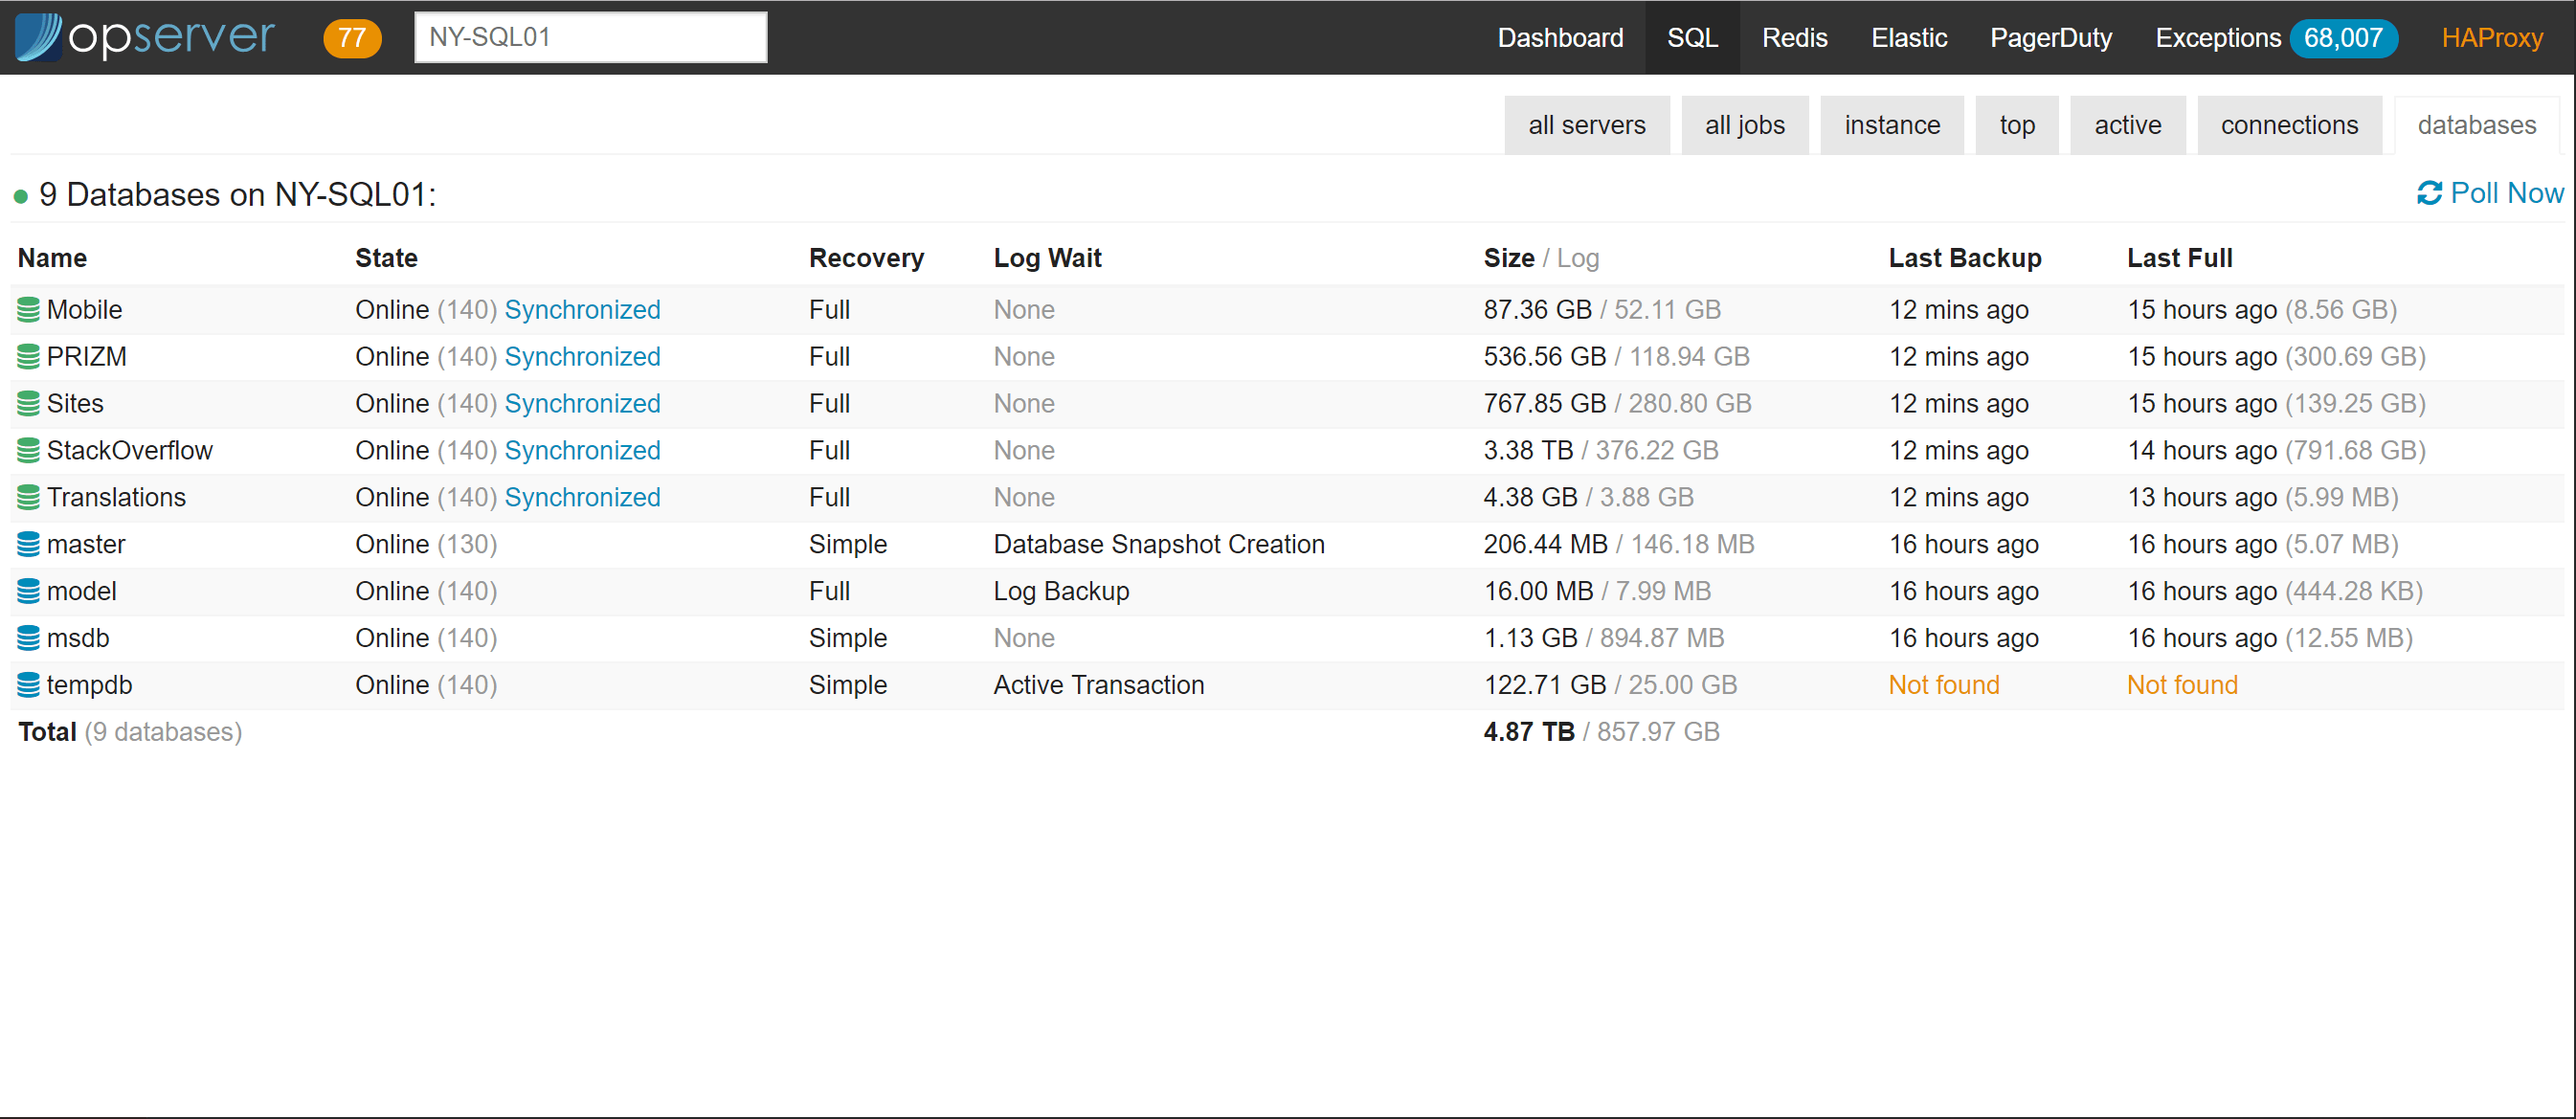
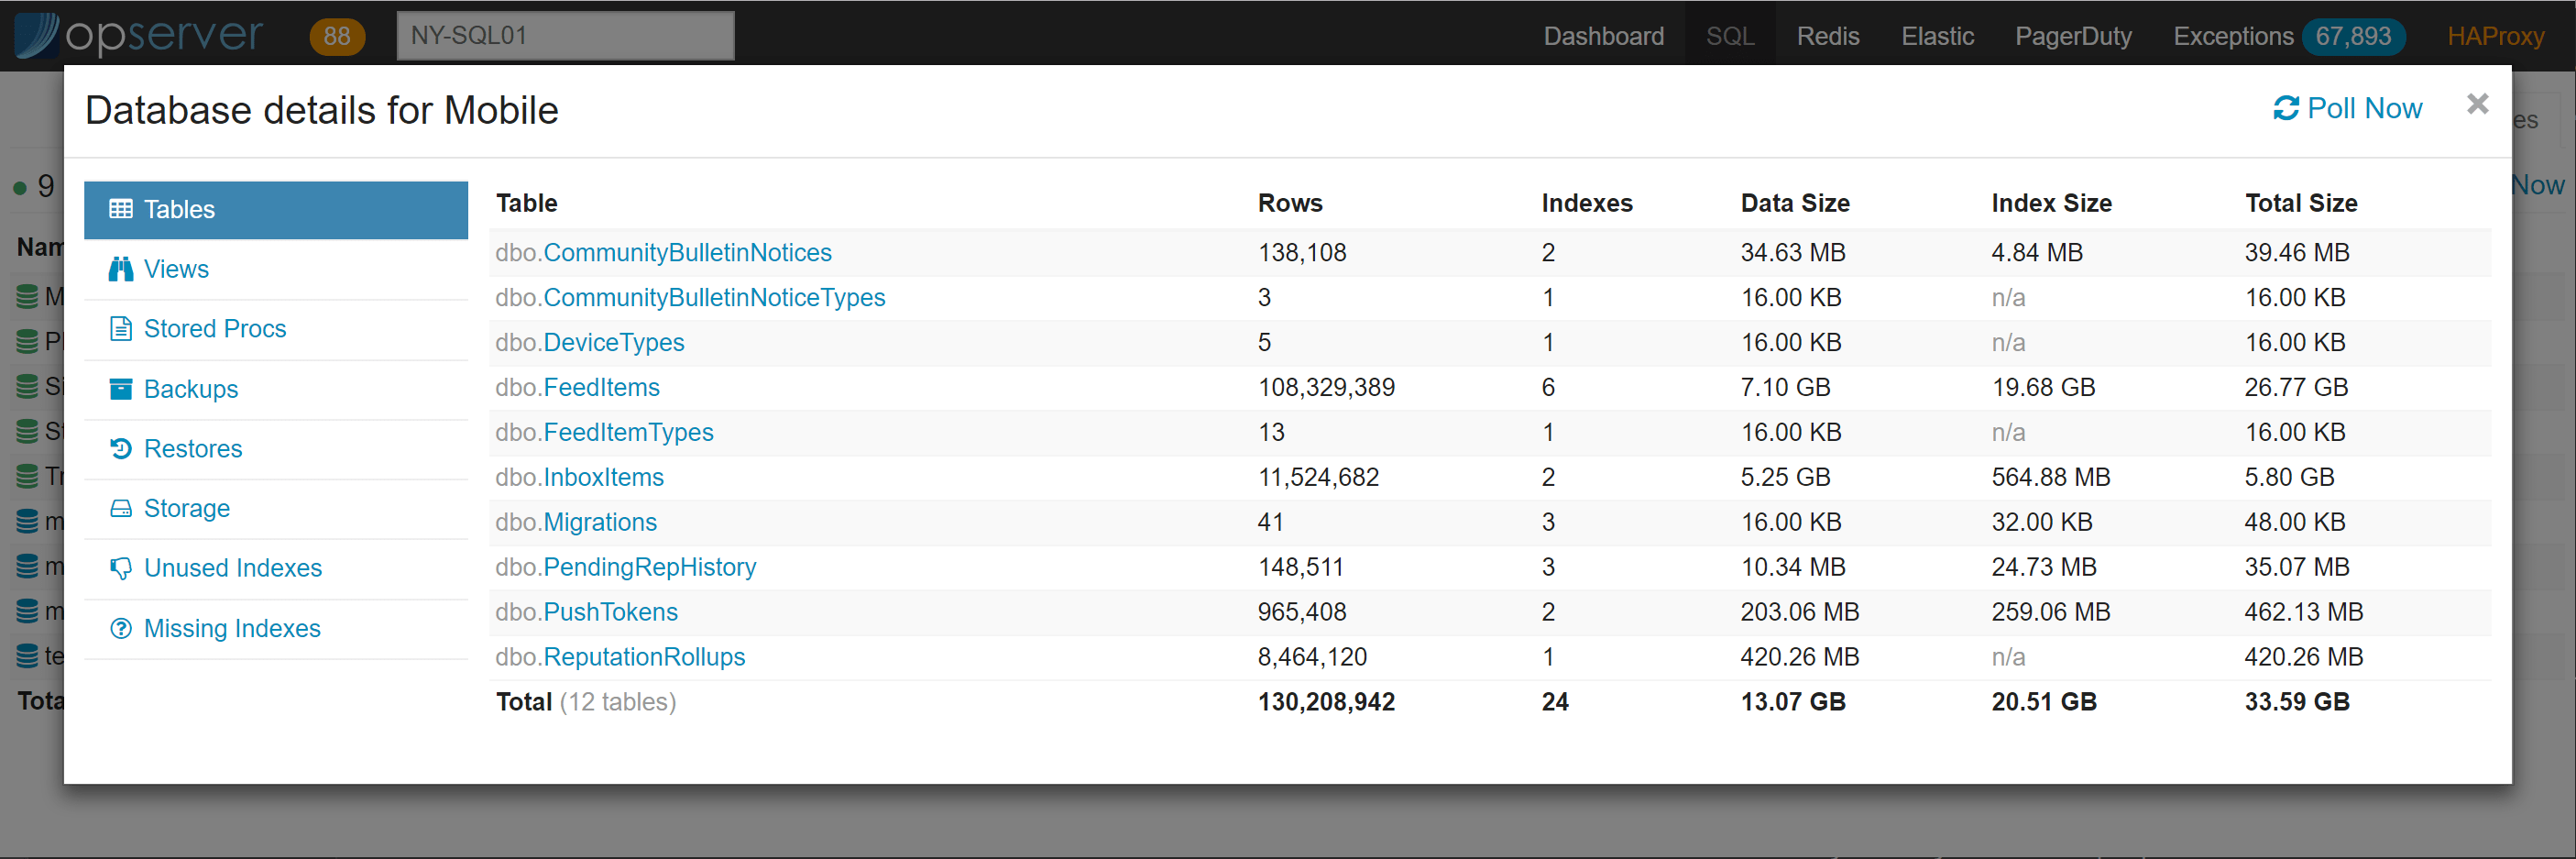
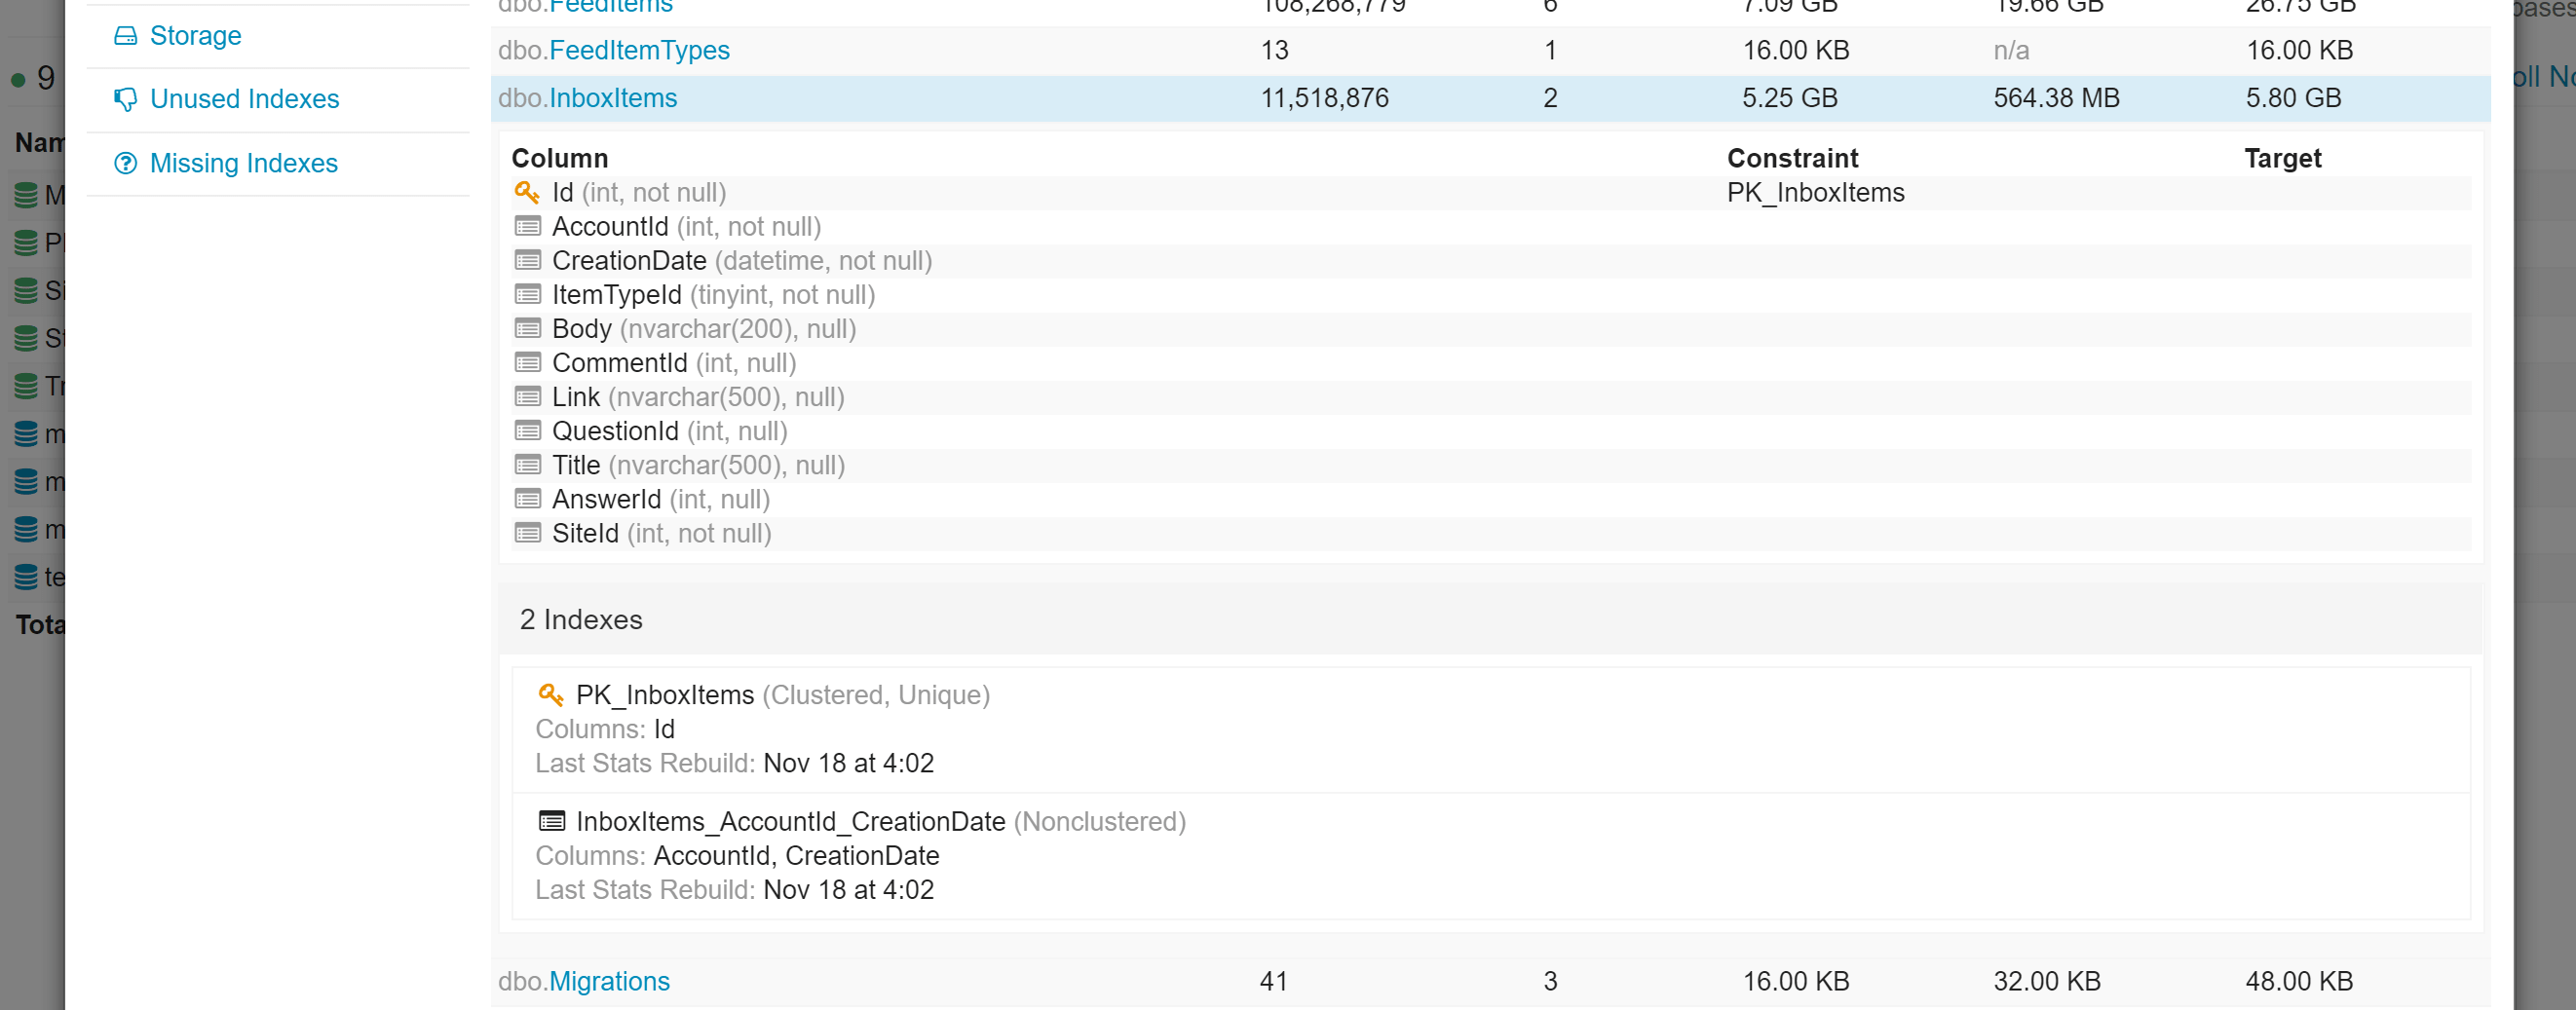
In the databases view, there are drill downs to see tables, indexes, views, stored procedures, storage usage, etc.
Opserver: Redis
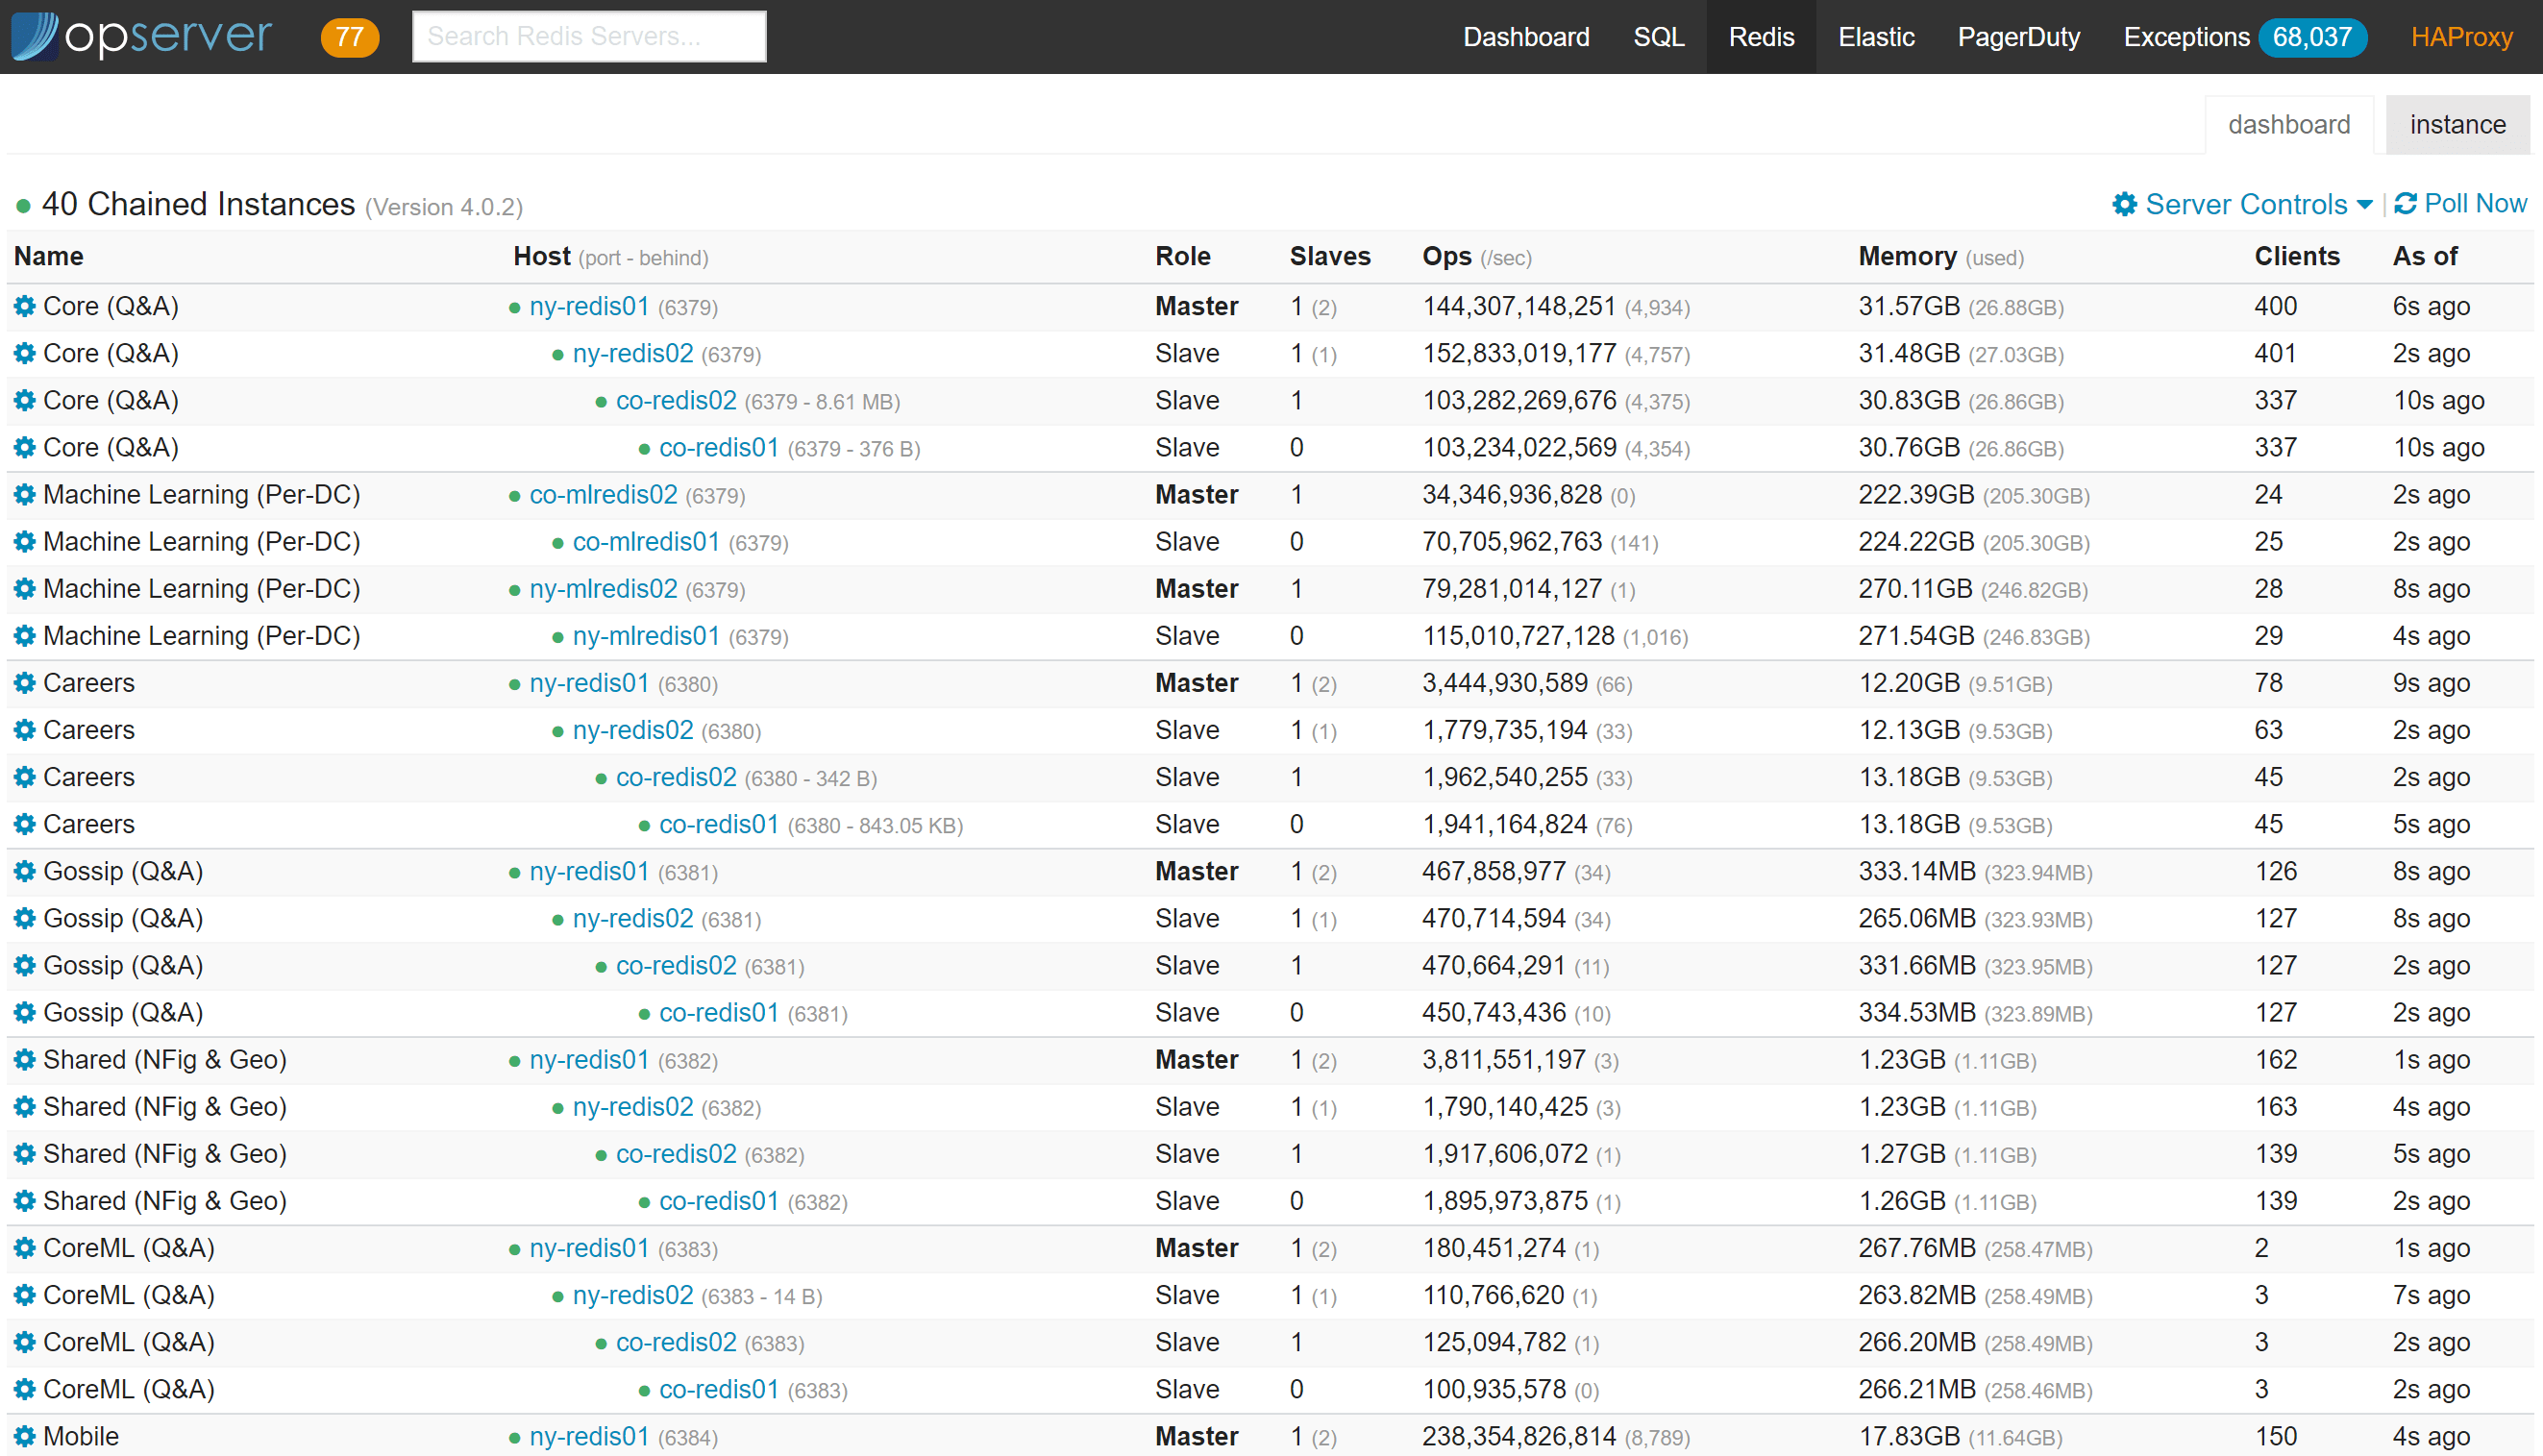
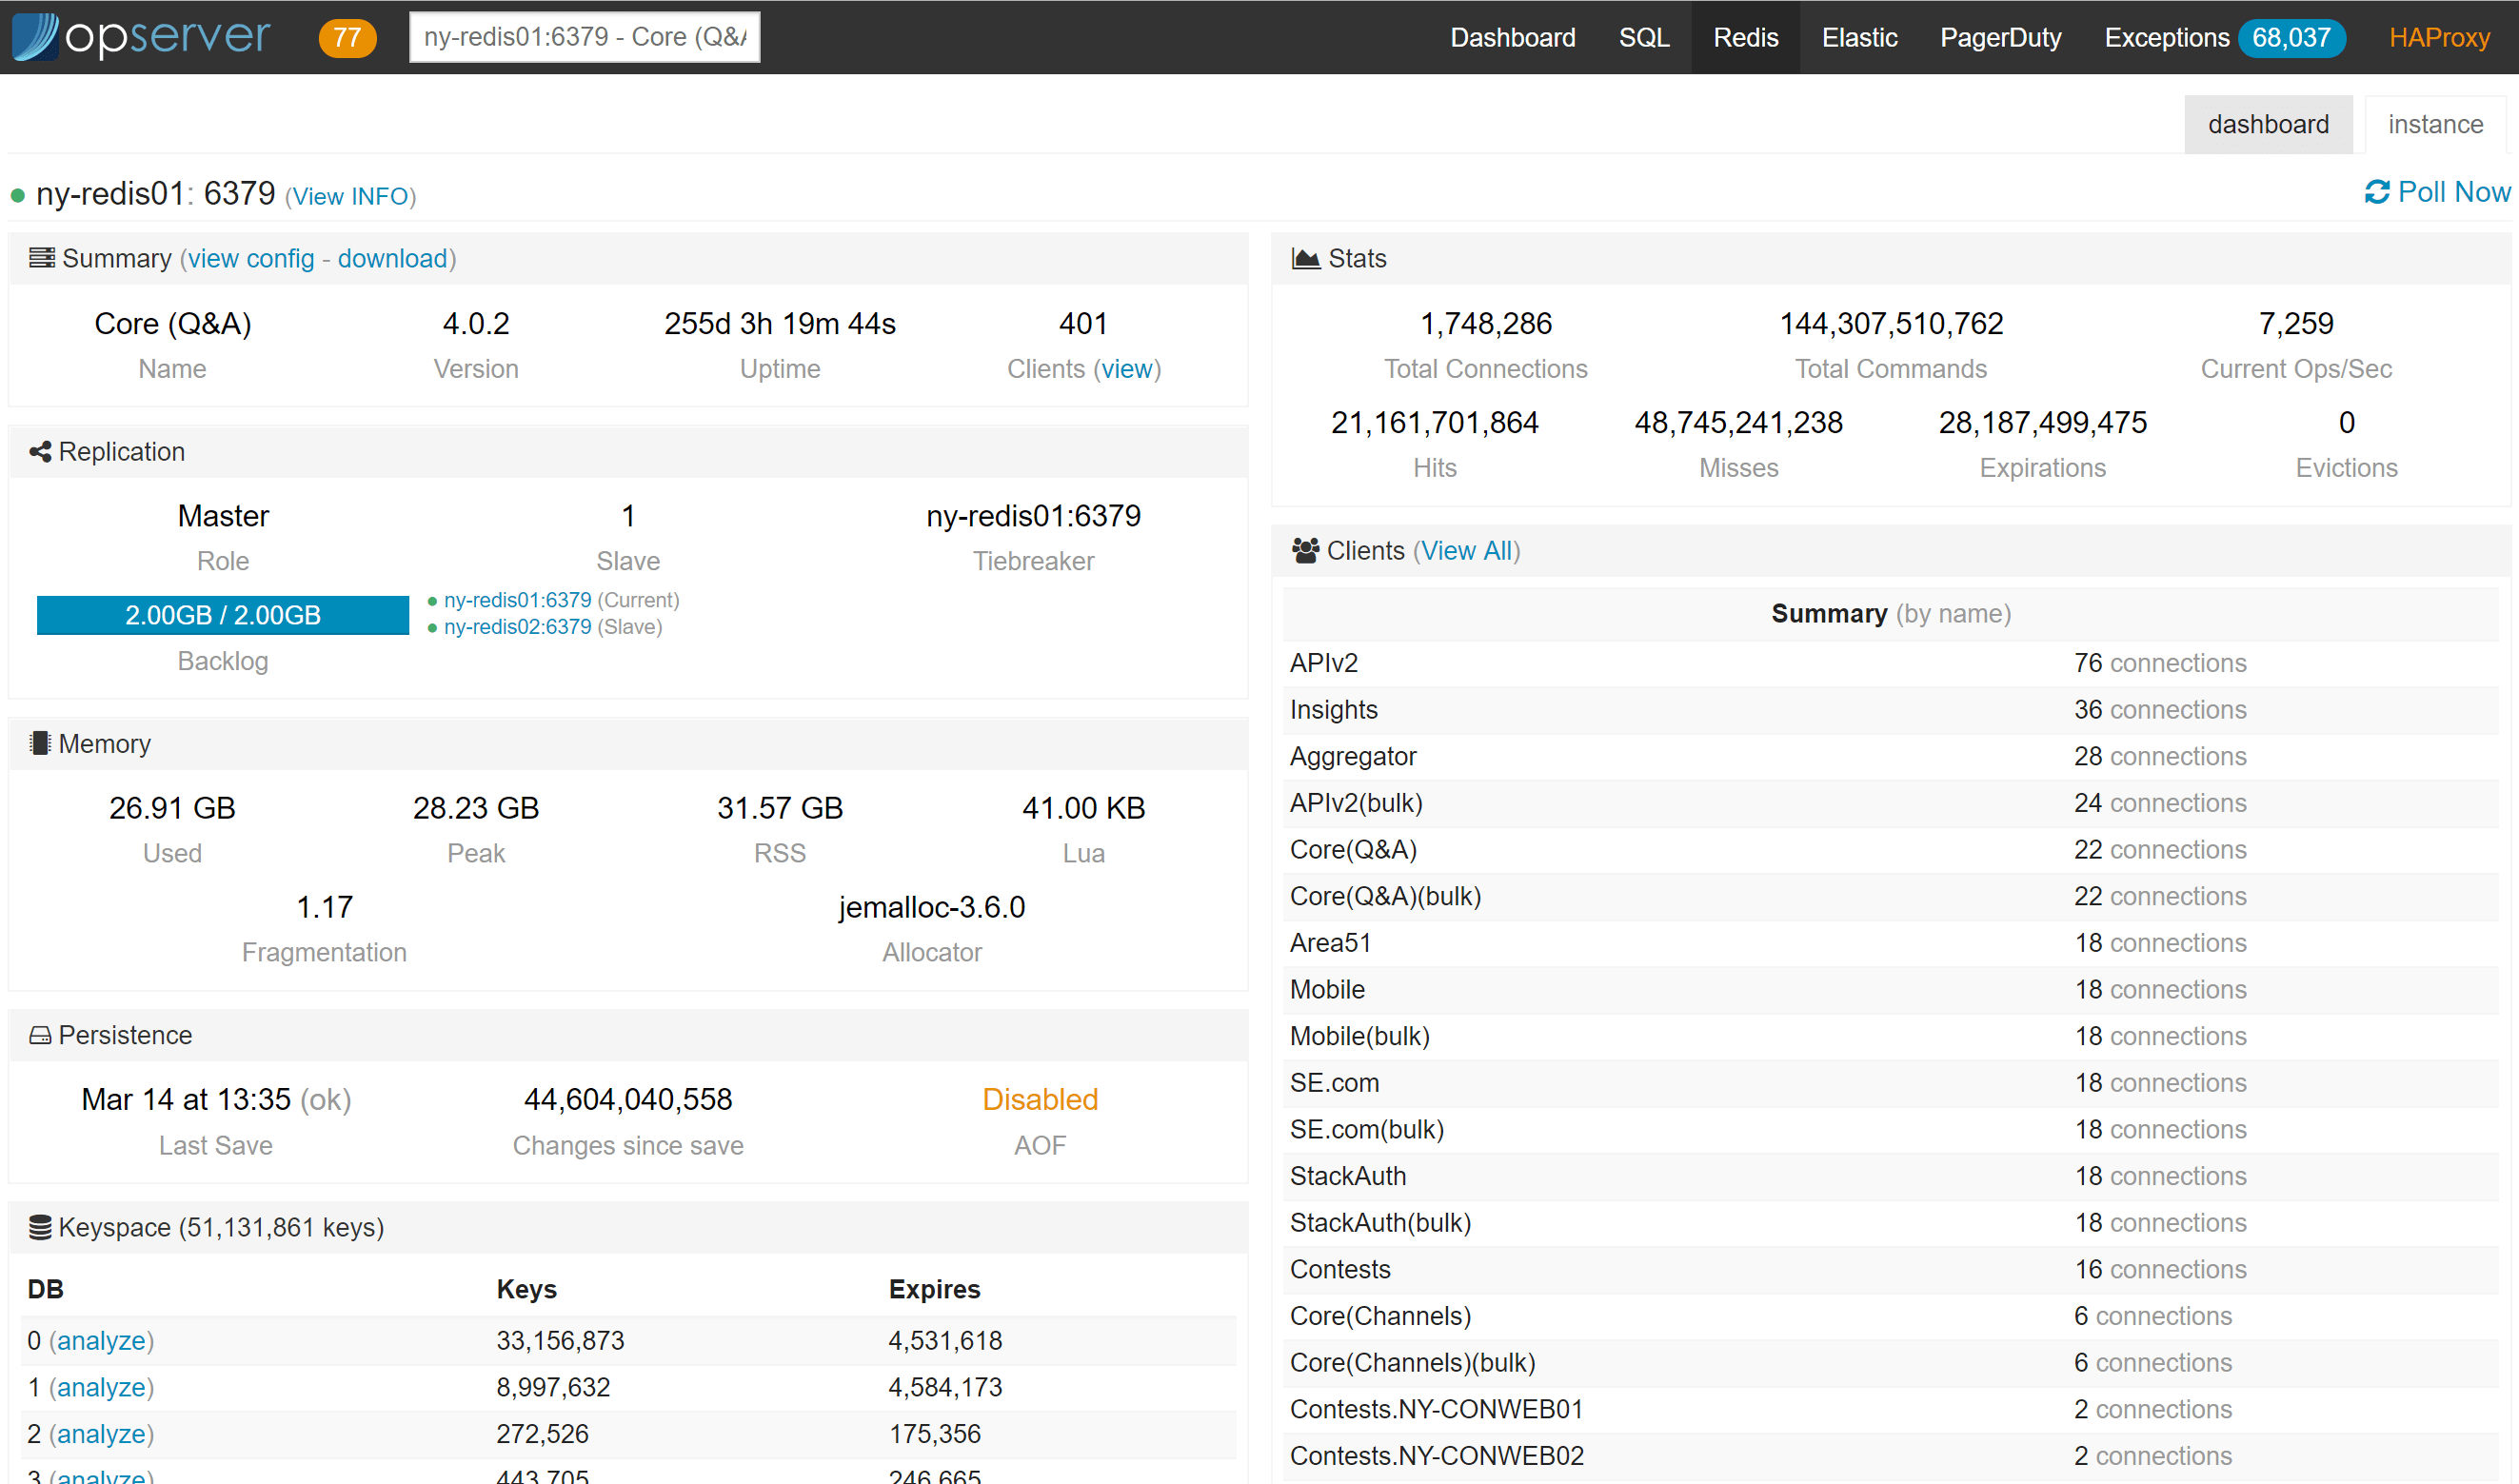
For Redis, we want to see the topology chain of primary and replicas as well as the overall status of each instance:
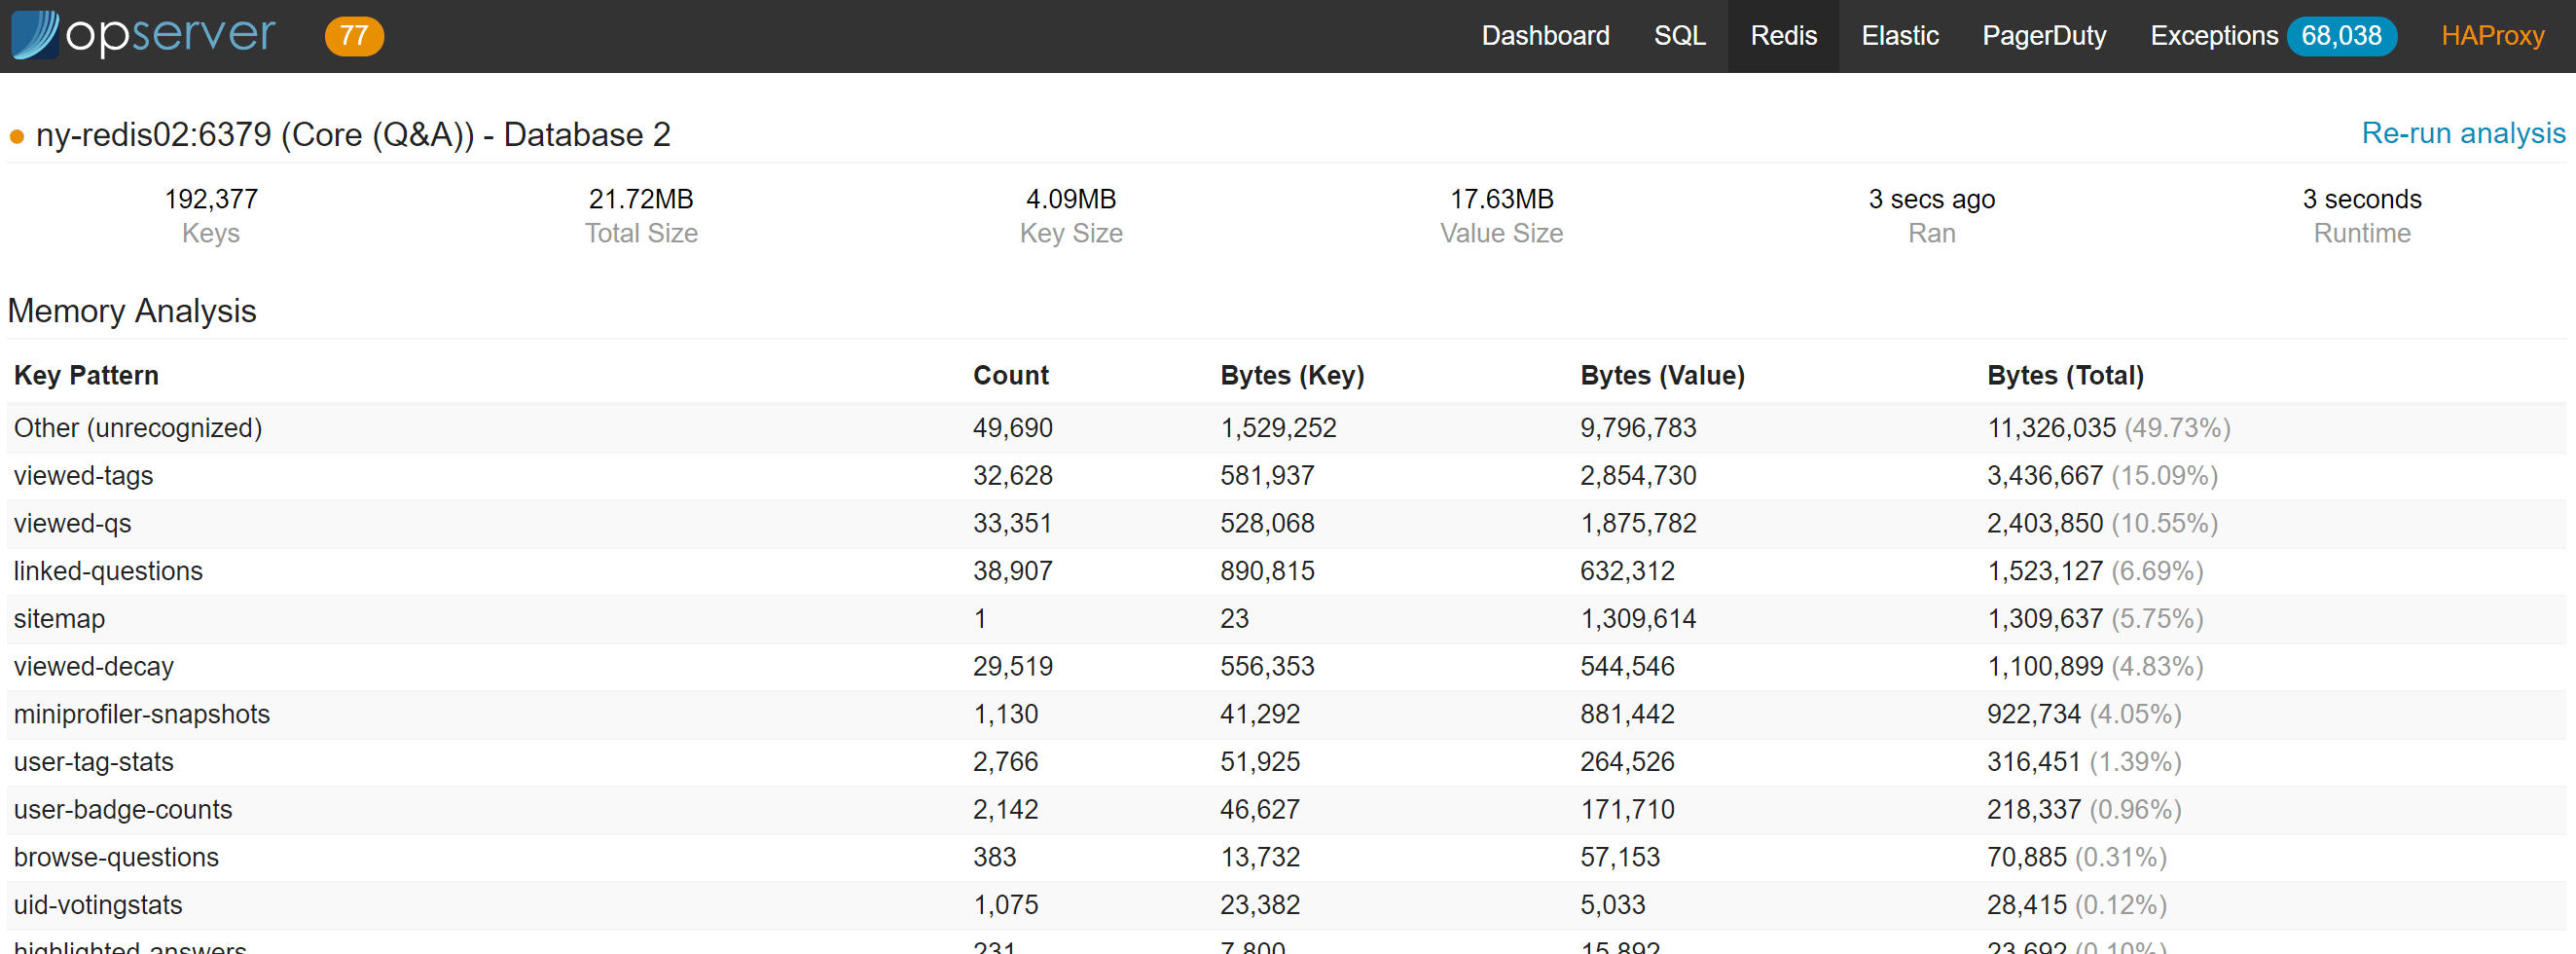
Note that you can kill client connections, get the active config, change server topologies, and analyze the data in each database (configurable via Regexes).
The last one is a heavy KEYS and DEBUG OBJECT scan, so we run it on a replica node or are allowed to force running it on a master (for safety).
Analysis looks like this:
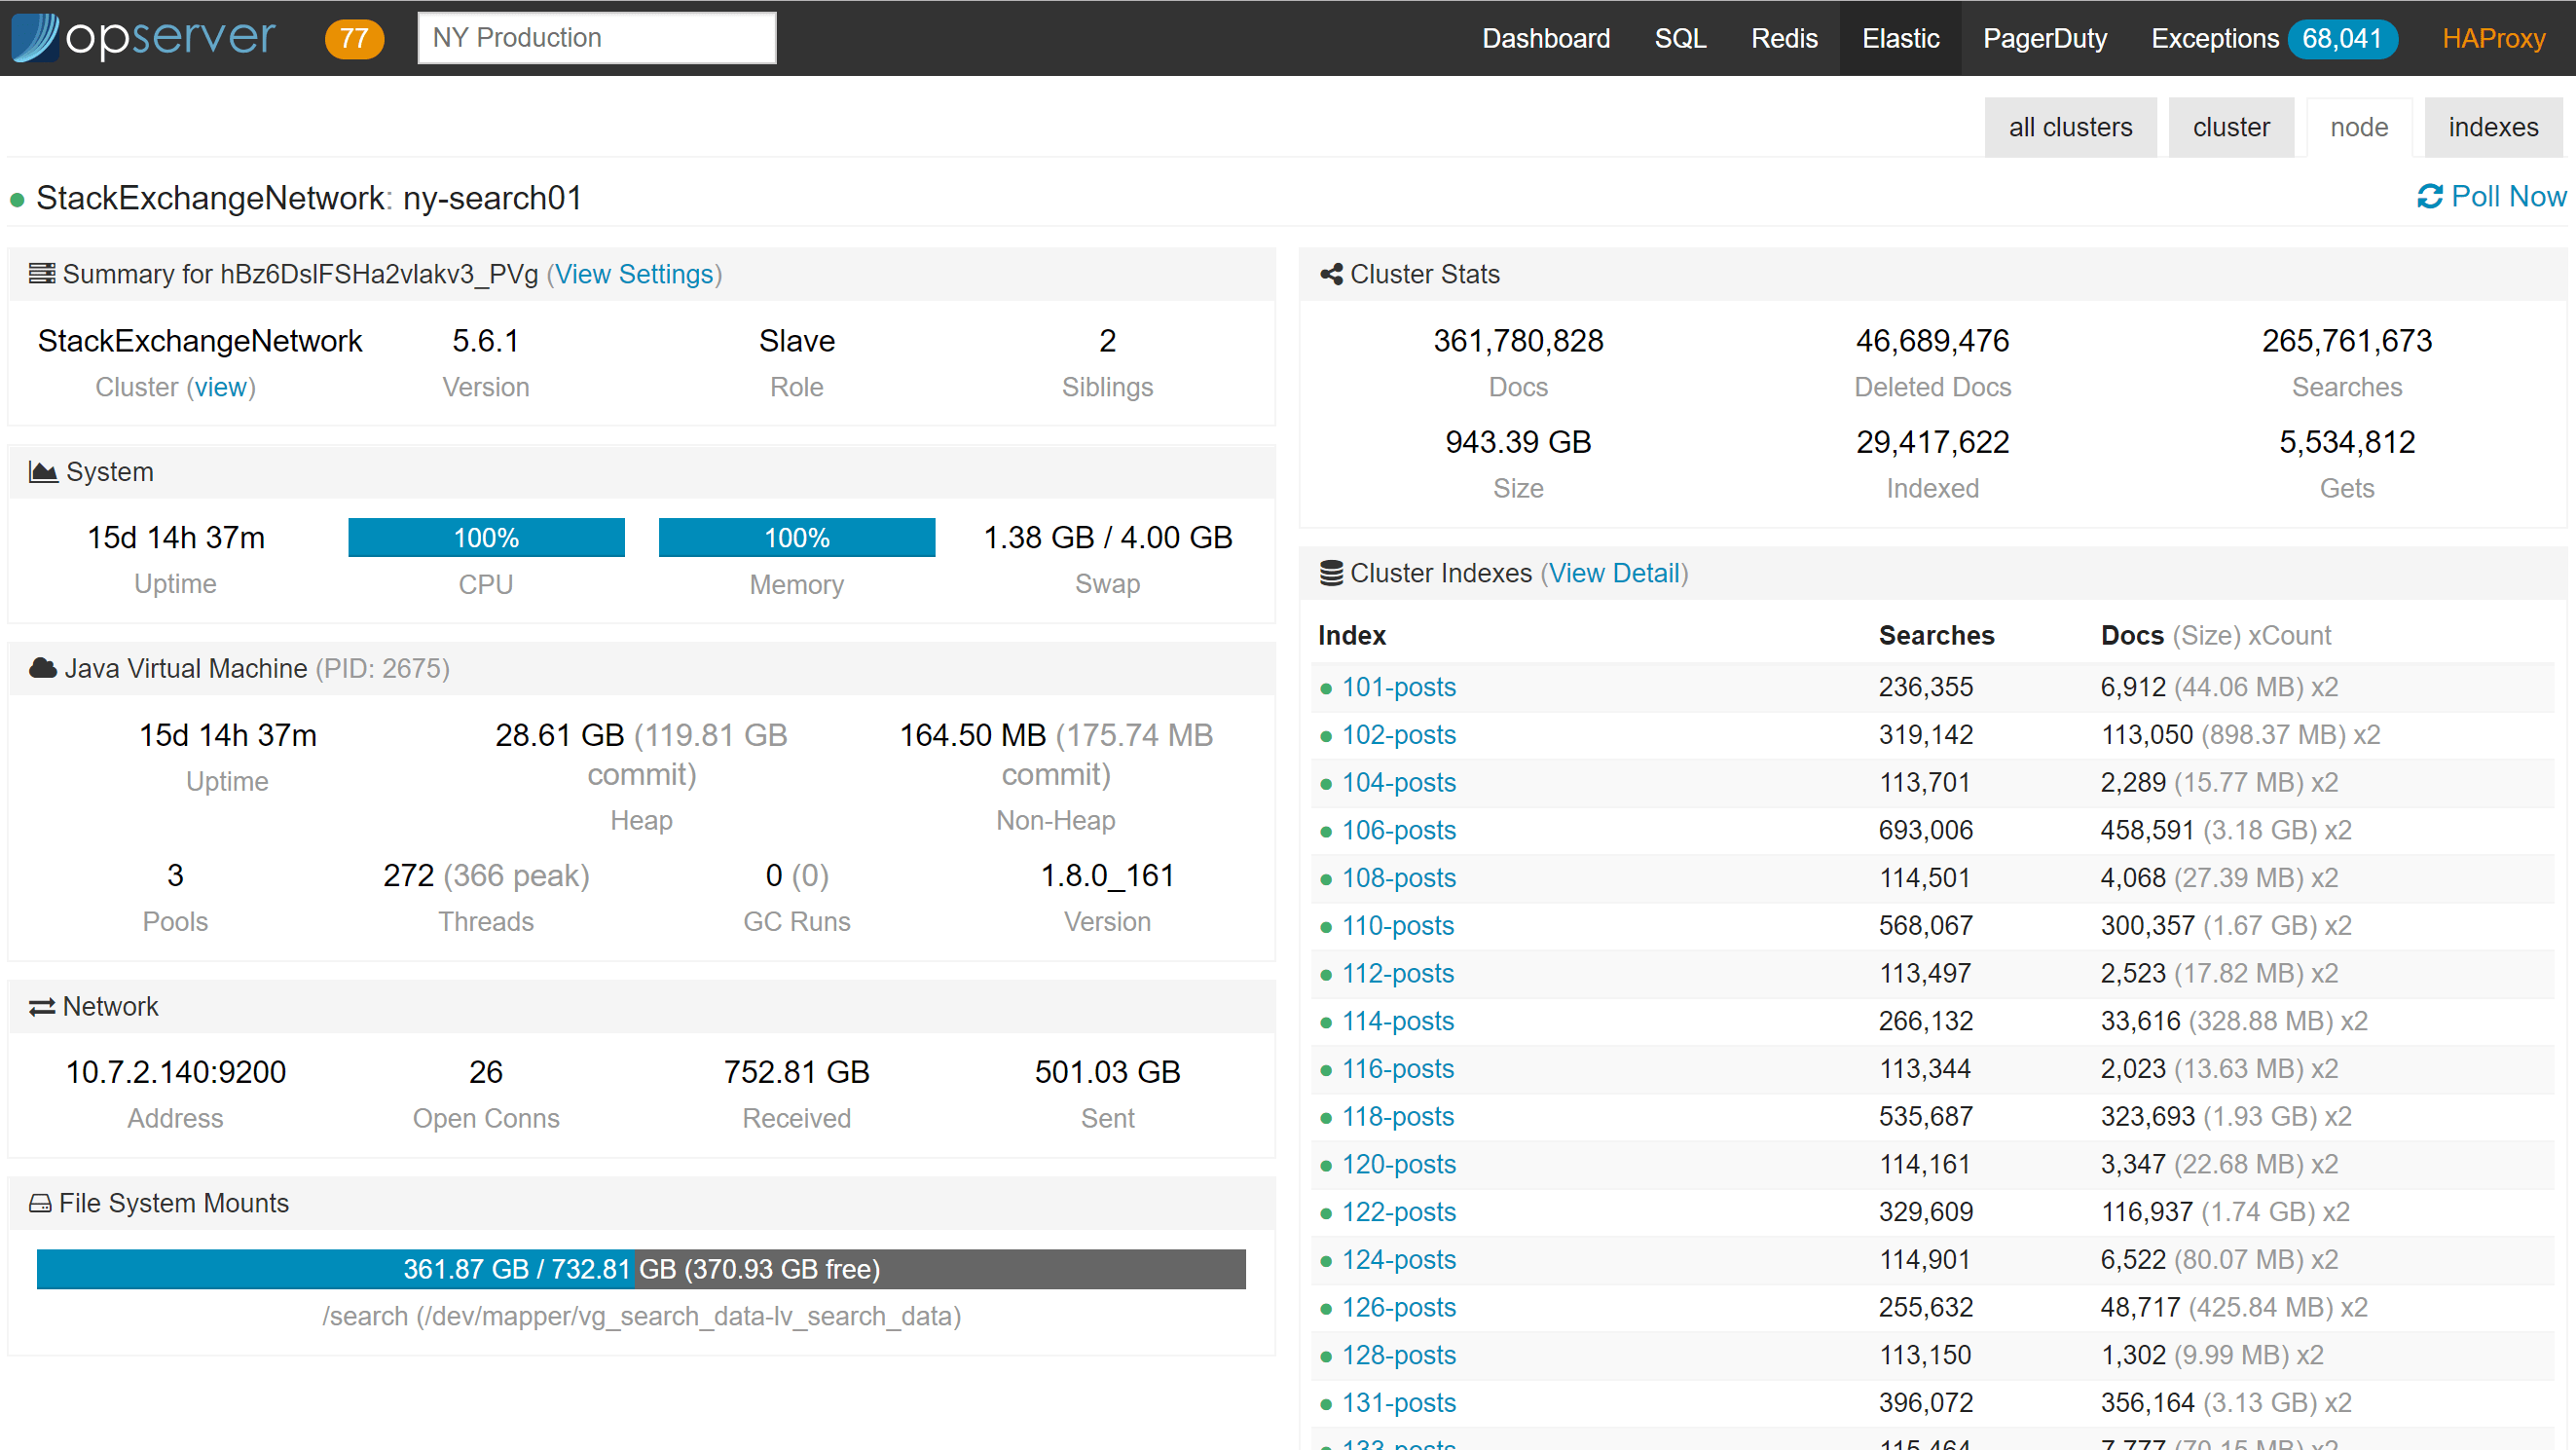
Opserver: Elasticsearch
For Elasticsearch, we usually want to see things in a cluster view since that’s how it behaves. What isn’t seen below is that when an index goes yellow or red. When that happens, new sections of the dashboard appear showing shards that are in trouble, what they’re doing (initializing, relocating, etc.), and counts appear in each cluster summarizing how many are in which status.
Note: the PagerDuty tab up there pulls from the PagerDuty API and displays on-call information, who’s primary, secondary, allows you to see and claim incidents, etc. Since it’s almost 100% not data you’d want to share, there’s no screenshot here. :) It also has a configurable raw HTML section to give visitors instructions on what to do or who to reach out to.
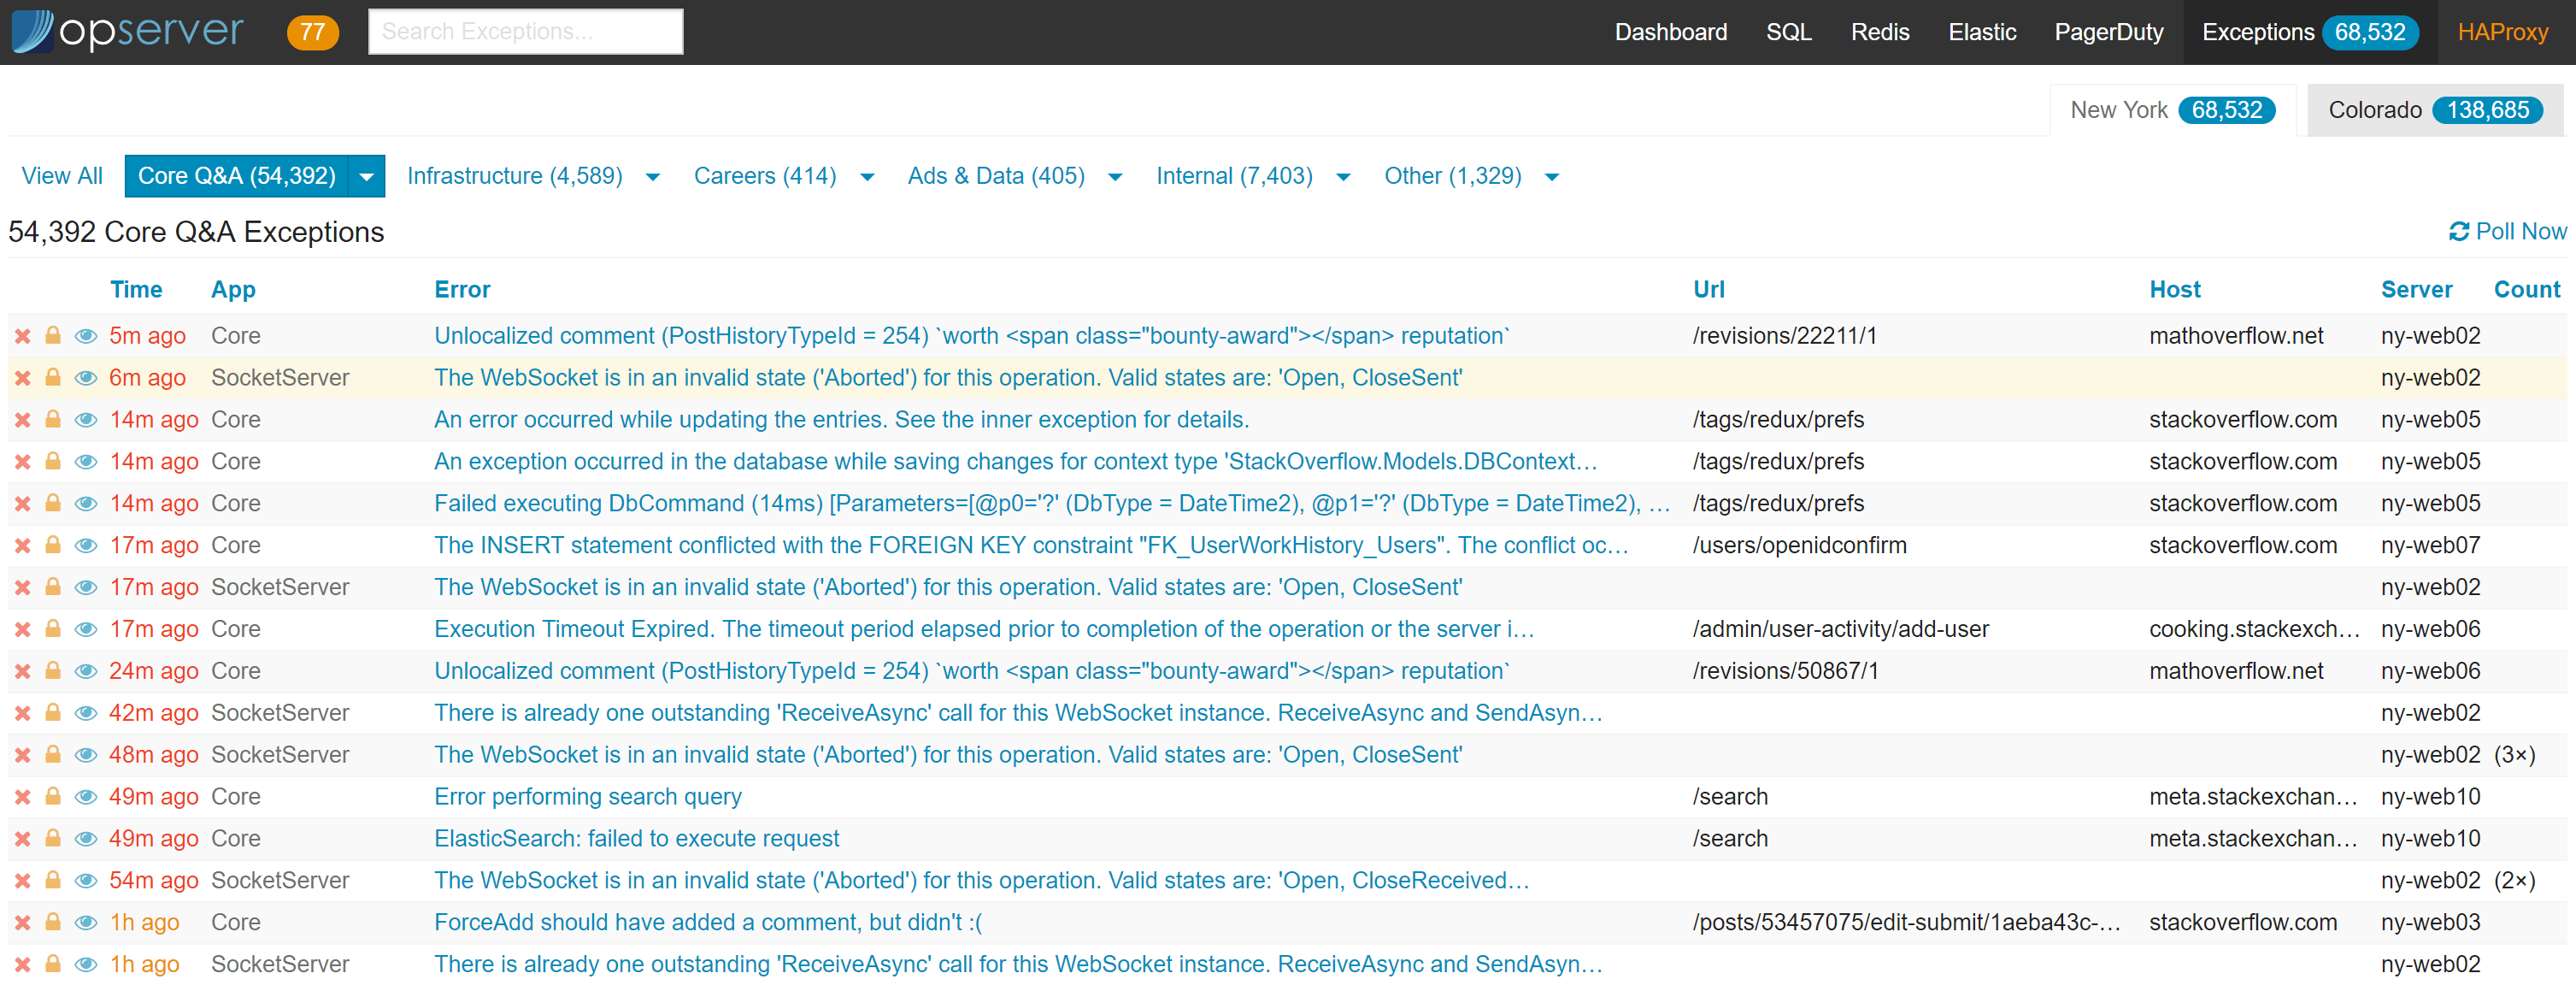
Opserver: Exceptions
Exceptions in Opserver are based on StackExchange.Exceptional. In this case specifically, we’re looking at the SQL Server storage provider for Exceptional. Opserver is a way for many applications to share a single database and table layout and have developers view their exceptions in one place.
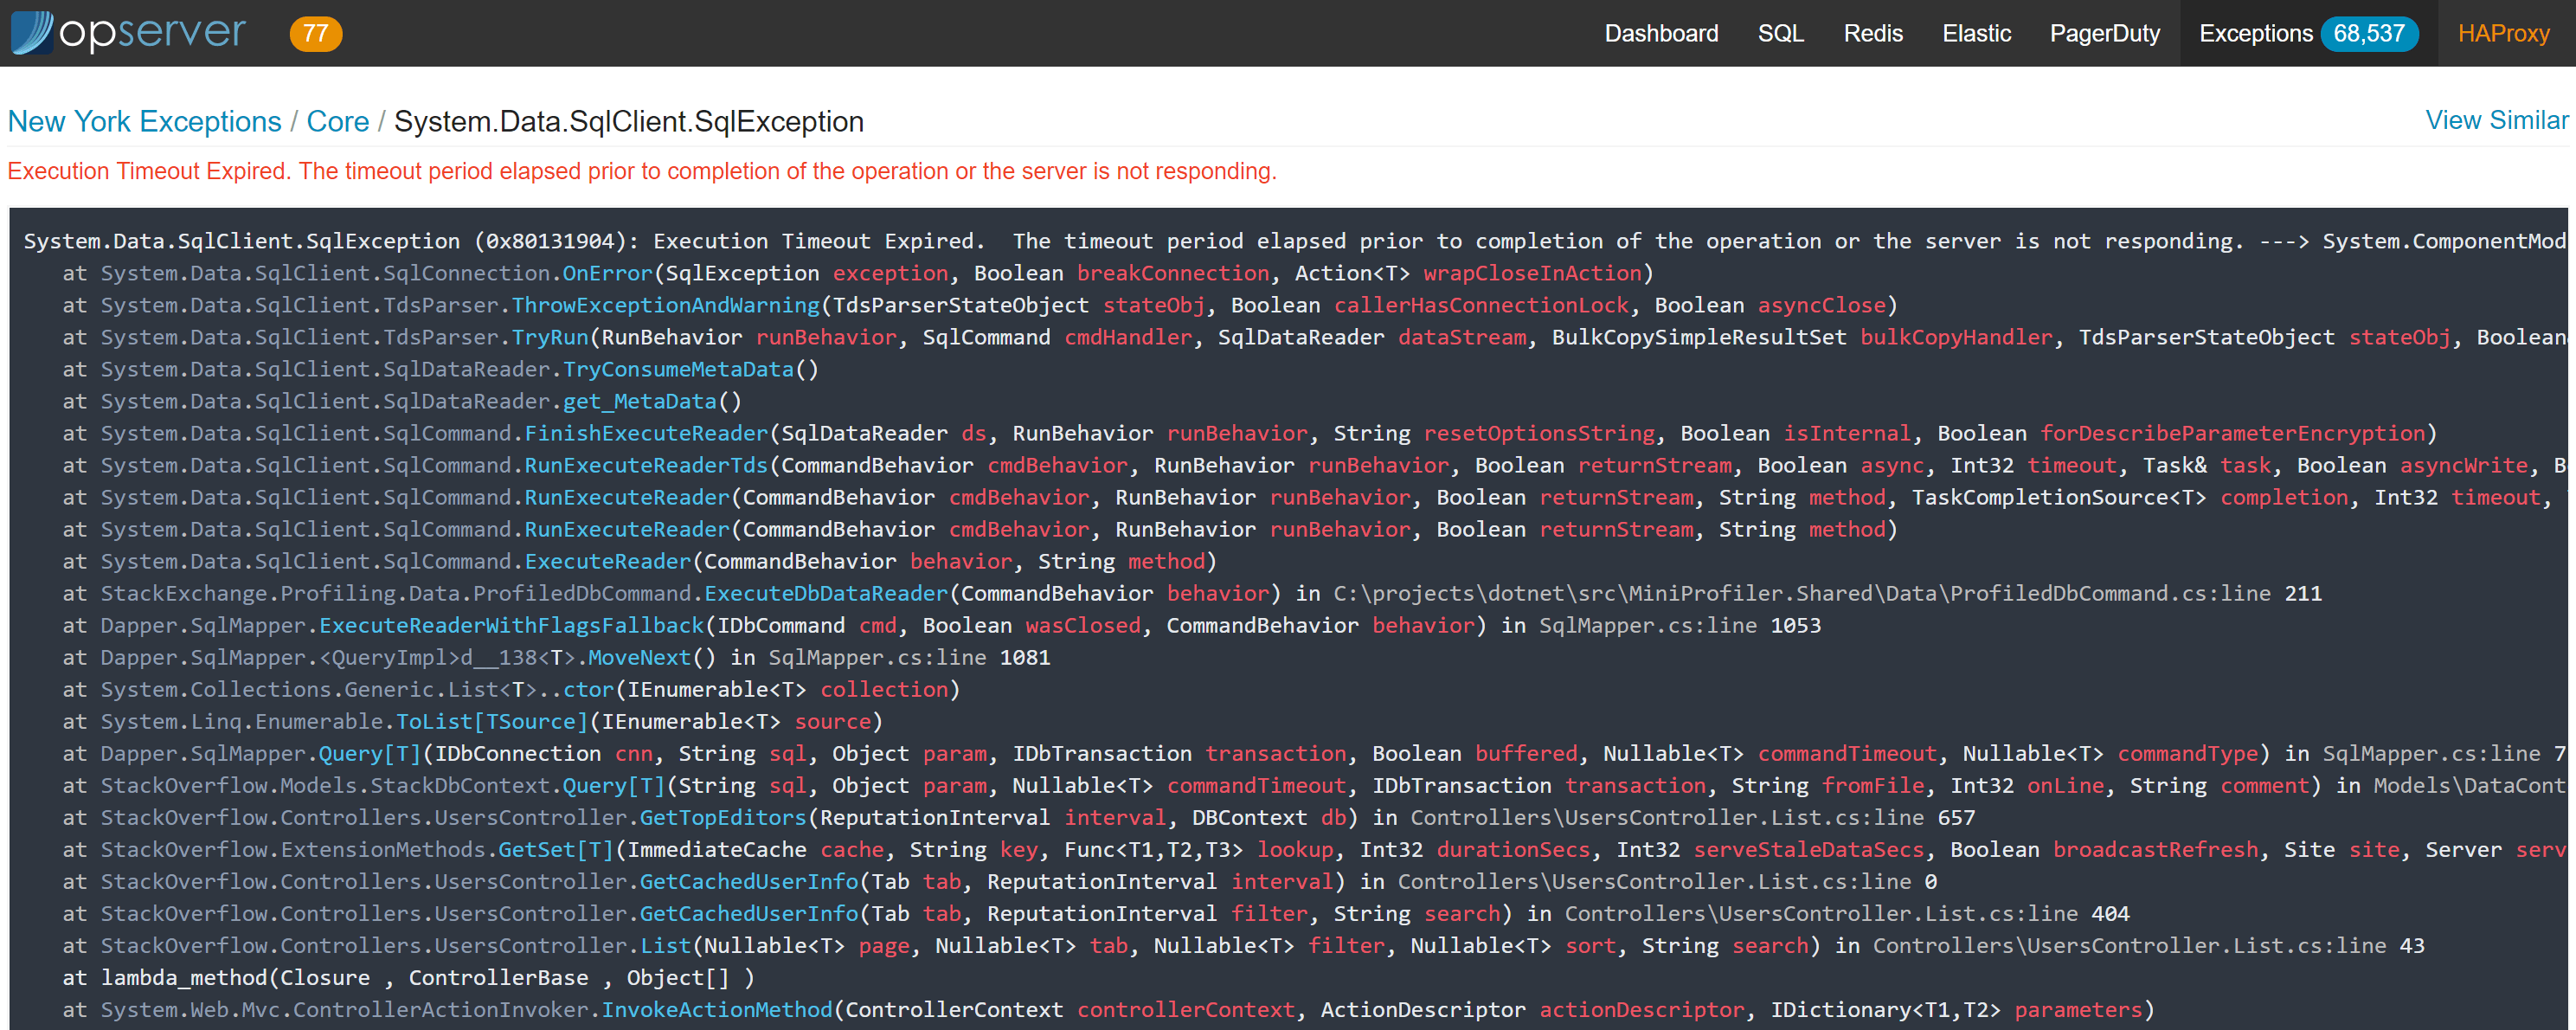
The top level view here can just be applications (the default), or it can be configured in groups. In the above case, we’re configuring application groups by team so a team can bookmark or quickly click on the exceptions they’re responsible for. In the per-exception page, the detail looks like this:
There are also details recorded like request headers (with security filters so we don’t log authentication cookies for example), query parameters, and any other custom data added to an exception.
Note: you can configure multiple stores, for instance we have New York and Colorado above. These are separate databases allowing all applications to log to a very-local store and still get to them from a single dashboard.
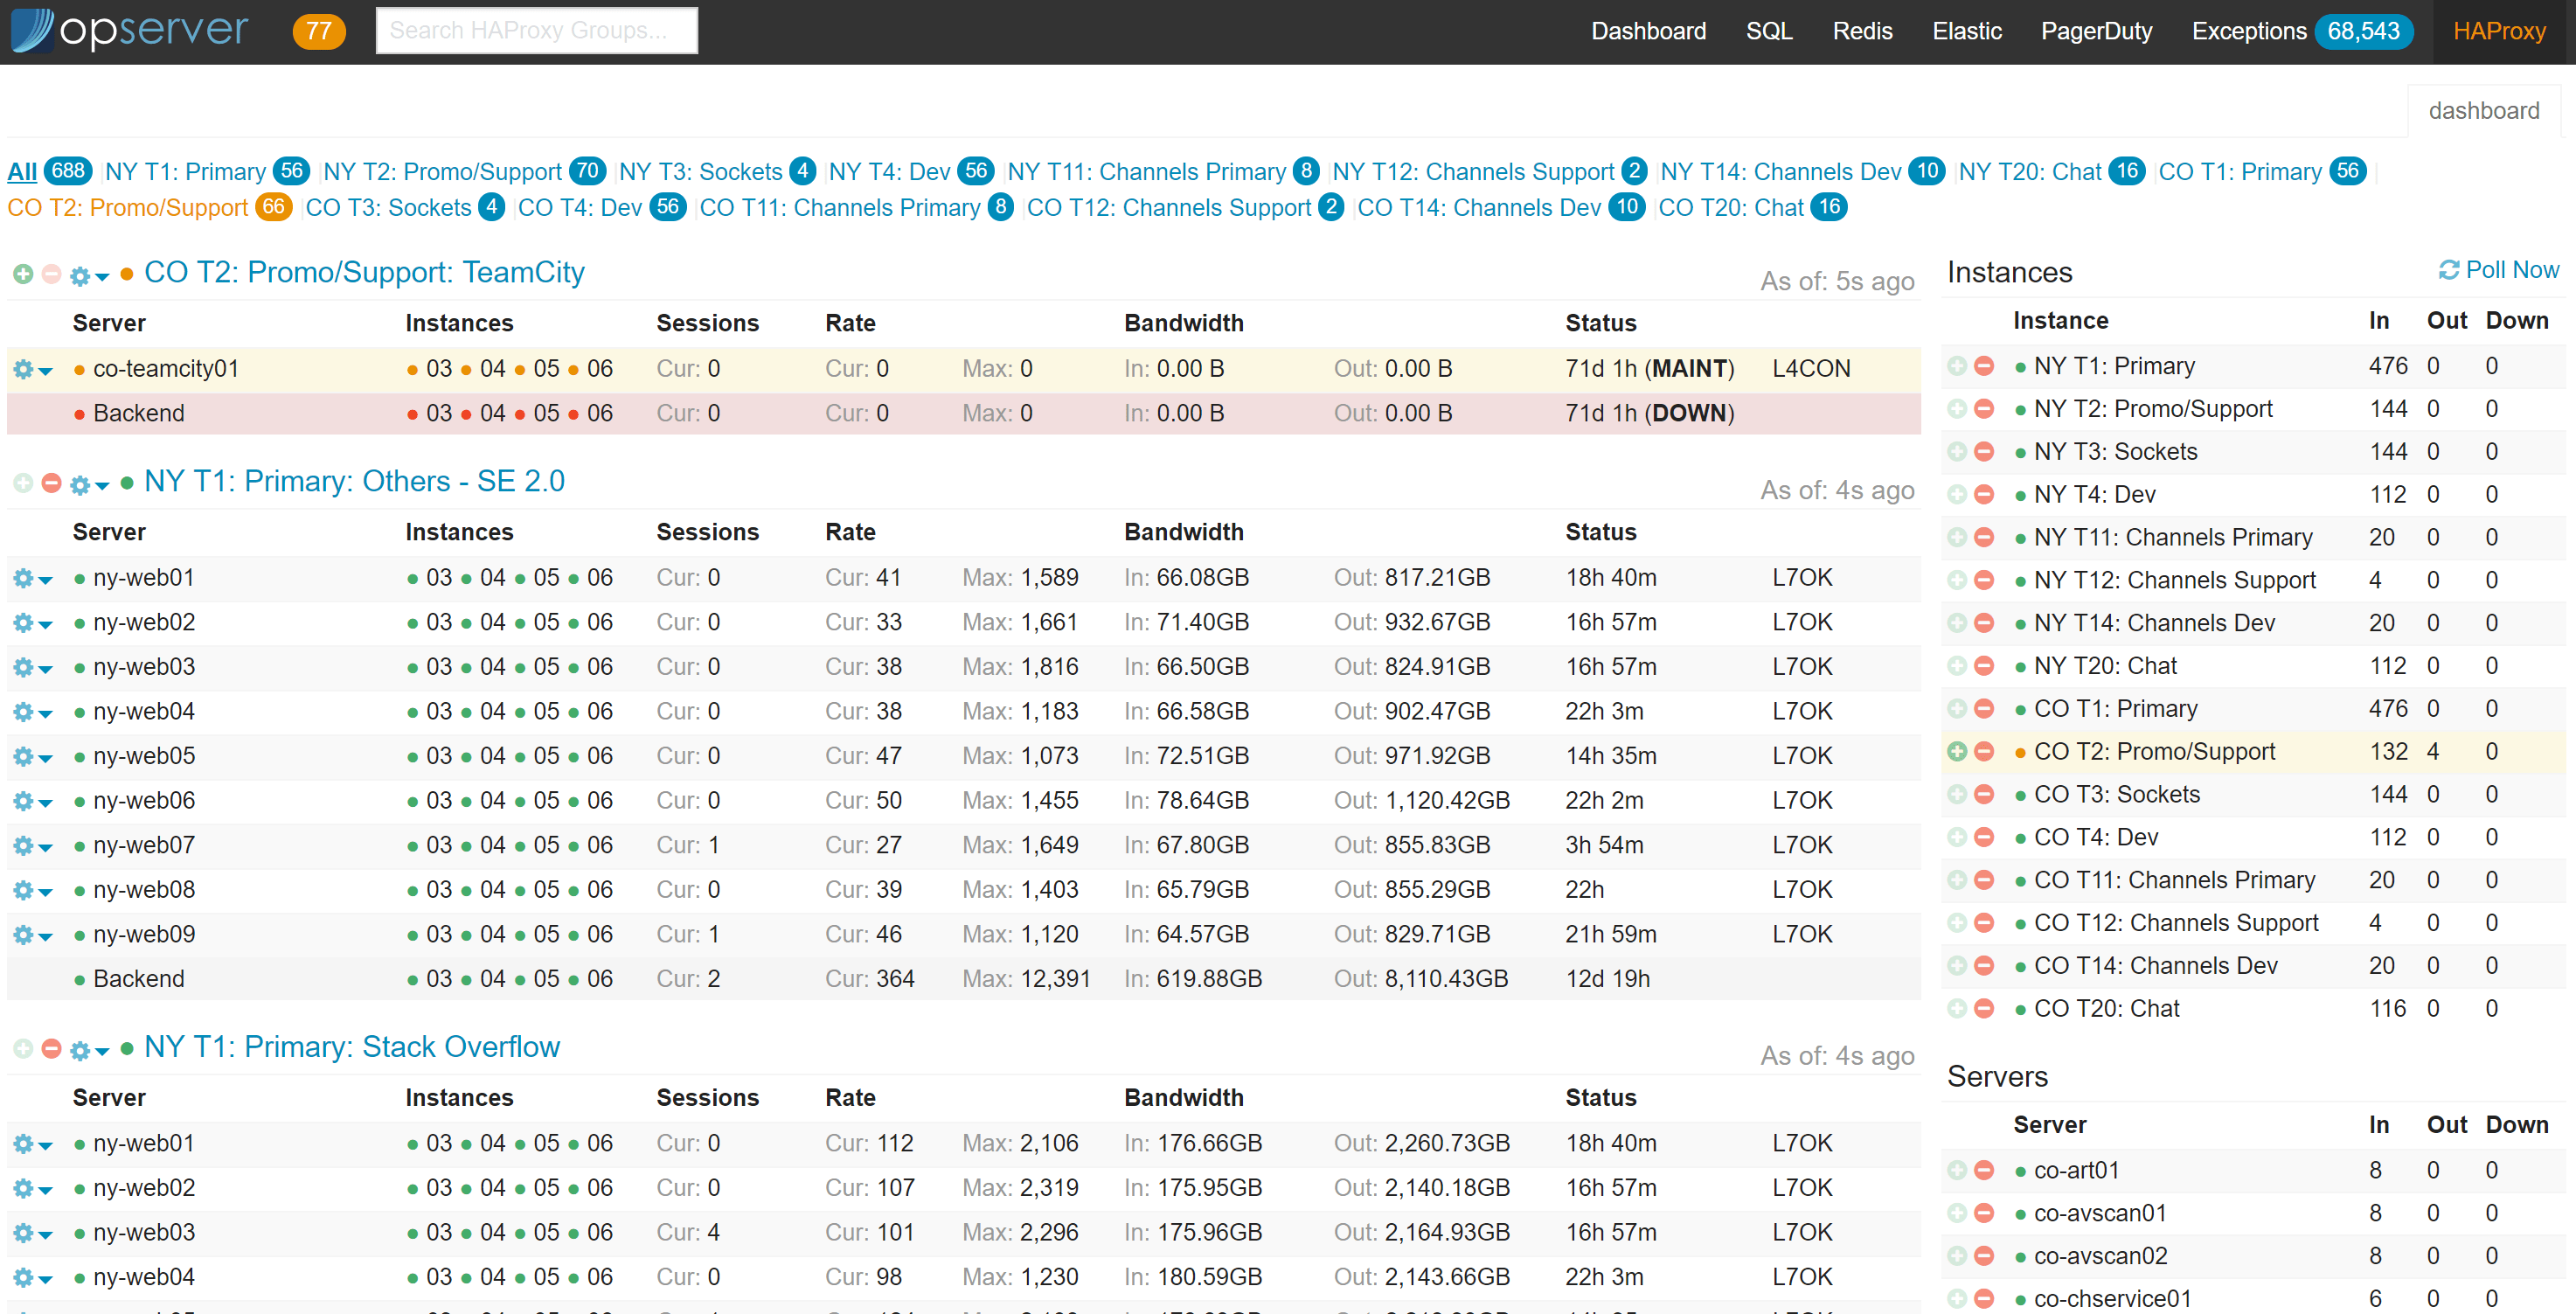
Opserver: HAProxy
The HAProxy section is pretty straightforward–we’re simply presenting the current HAProxy status and allowing control of it. Here’s what the main dashboard looks like:
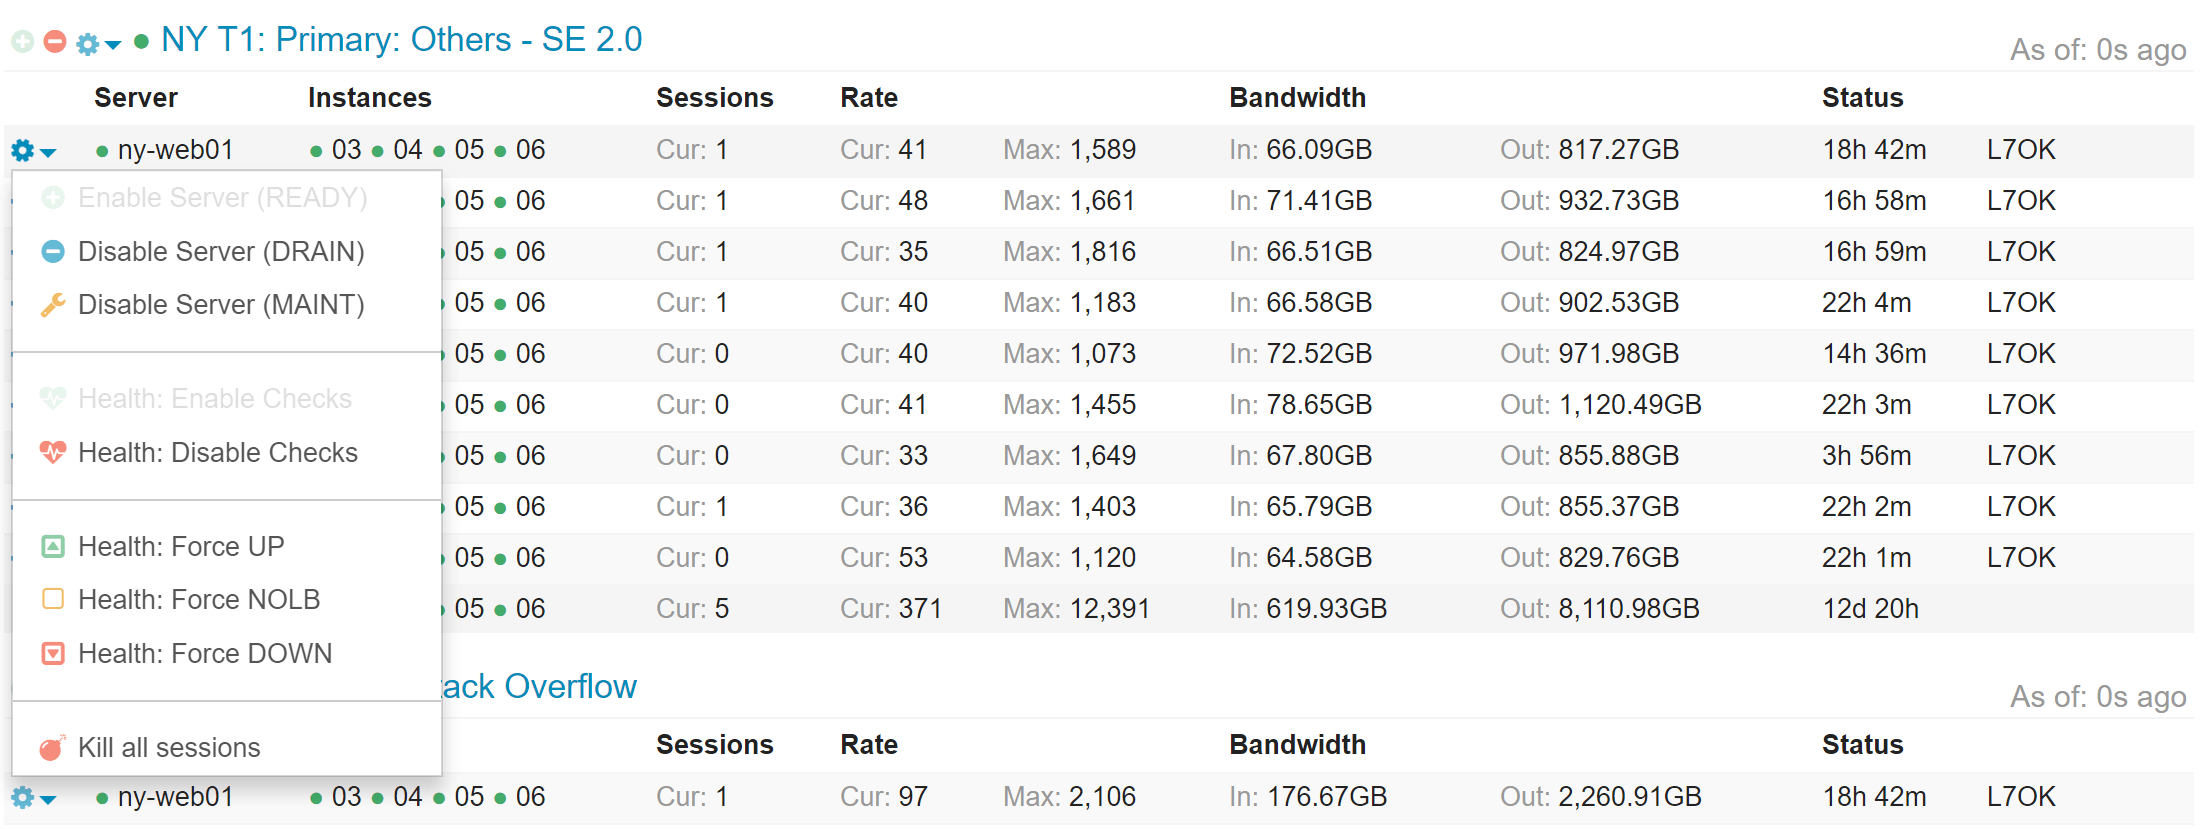
For each background group, specific backend server, entire server, or entire tier, it also allows some control. We can take a backend server out of rotation, or an entire backend down, or a web server out of all backends if we need to shut it down for emergency maintenance, etc.
Opserver: FAQs
I get the same questions about Opserver routinely, so let’s knock a few of them out:
- Opserver does not require a data store of any kind for itself (it’s all config and in-memory state).
- This may happen in the future to enhance functionality, but there are no plans to require anything.
- Only the dashboard tab and per-node view is powered by Bosun, Orion, or WMI - all other screens like SQL, Elastic, Redis, etc. have no dependency…Opserver monitors these directly.
- Authentication is both global and per-tab pluggable (who can view and who’s an admin are separate), but built-in configuration is via groups and Active Directory is included.
- On admin vs. viewer: A viewer gets a read-only view. For example, HAProxy controls wouldn’t be shown.
- All tabs are not required–each is independent and only appears if configured.
- For example, if you wanted to only use Opserver as an Elastic or Exceptions dashboard, go nuts.
Note: Opserver is currently being ported to ASP.NET Core as I have time at night. This should allow it to run without IIS and hopefully run on other platforms as well soon. Some things like AD auth to SQL Servers from Linux and such is still on the figure-it-out list. If you’re looking to deploy Opserver, just be aware deployment and configuration will change drastically soon (it’ll be simpler) and it may be better to wait.
Where Do We Go Next?
Monitoring is an ever-evolving thing. For just about everyone, I think. But I can only speak of plans I’m involved in…so what do we do next?
Health Check Next Steps
Health check improvements are something I’ve had in mind for a while, but haven’t found the time for. When you’re monitoring things, the source of truth is a matter of concern. There’s what a thing is and what a thing should be. Who defines the latter? I think we can improve things here on the dependency front and have it generally usable across the board (…and I really hope someone’s already doing similar, tell me if so!). What if we had a simple structure from the health checks like this:
public class HealthResult
{
    public string AppName { get; set; }
    public string ServerName { get; set; }
    public HealthStatus Status { get; set; }
    public List<string> Tags { get; set; }
    public List<HealthResult> Dependencies { get; set; }
    public Dictionary<string, string> Attributes { get; set; }
}
public enum HealthStatus
{
    Healthy,
    Warning,
    Critical,
    Unknown
}
This is just me thinking out loud here, but the key part is the Dependencies.
What if you asked a web server “Hey buddy, how ya doing?” and it returned not a simple JSON object, but a tree of them?
But each level is all the same thing, so overall we’d have a recursive list of dependencies.
For example, a dependency list that included Redis–if we couldn’t reach 1 of 2 Redis nodes, we’d have 2 dependencies in the list, a Healthy for one and a Critical or Unknown for the other in the dependency list and the web server would be Warning instead of Healthy.
The main point here is: the monitoring system doesn’t need to know about dependencies. The systems themselves define them and return them. This way we don’t get into config skew where what’s being monitored doesn’t match what should be there. This can happen often in deployments with topology or dependency changes.
This may be a terrible idea, but it’s a general one I have for Opserver (or any script really) to get a health reading and the why of a health reading.
If we lose another node, these n things break.
Or, we see the common cause of n health warnings.
By pointing at a few endpoints, we could get a tree view of everything.
Need to add more data for your use case? Sure!
It’s JSON, so just inherit from the object and add more stuff as needed.
It’s an easily extensible model. I think.
I need to take the time to build this…maybe it’s full of problems.
Or maybe someone reading this will tell me it’s already done (hey you!).
Bosun Next Steps
Bosun has largely been in maintenance mode due to a lack of resources and other priorities. We haven’t done as much as we’d like because we need to have the discussion on the best path forward. Have other tools caught up and filled the gaps that caused us to build it in the first place? Has SQL 2017 or 2019 already improved the queries we had issues with lowering the bar greatly? We need to take some time and look at the landscape and evaluate what we want to do. This is something we want to get into during Q1 2019.
We know of some things we’d like to do, such as improving the alert editing experience and some other UI areas. We just need to weigh some things and figure out where our time is best spent as with all things.
Metrics Next Steps
We are drastically under-utilizing metrics across our applications. We know this. The system was built for SREs and developers primarily, but showing developers all the benefits and how powerful metrics are (including how easy they are to add) is something we haven’t done well. This is a topic we discussed at a company meetup last month. They’re so, so cheap to add and we could do a lot better. Views differ here, but I think it’s mostly a training and awareness issue we’ll strive to improve.
The health checks above…maybe we easily allow integrating metrics from BosunReporter there as well (probably only when asked for) to make one decently powerful API to check the health and status of a service. This would allow a pull model for the same metrics we normally push. It needs to be as cheap as possible and allocate little, though.
Tools Summary
I mentioned several tools we’ve built and open sourced above. Here’s a handy list for reference:
- Bosun: Go-based monitoring and alerting system – primary developed by Kyle Brandt, Craig Peterson, and Matt Jibson.
- Bosun: Grafana Plugin: A data source plugin for Grafana – developed by Kyle Brandt.
- BosunReporter: .NET metrics collector/sender for Bosun – developed by Bret Copeland.
- httpUnit: Go-based HTTP monitor for testing compliance of web endpoints – developed by Matt Jibson and Tom Limoncelli.
- MiniProfiler: .NET-based (with other languages available like Node and Ruby) lightweight profiler for seeing page render times in real-time – created by Marc Gravell, Sam Saffron, and Jarrod Dixon and maintained by Nick Craver.
- Opserver: ASP.NET-based monitoring dashboard for Bosun, SQL, Elasticsearch, Redis, Exceptions, and HAProxy – developed by Nick Craver.
- StackExchange.Exceptional: .NET exception logger to SQL, MySQL, Postgres, etc. – developed by Nick Craver.
…and all of these tools have additional contributions from our developer and SRE teams as well as the community at large.
What’s next? The way this series works is I blog in order of what the community wants to know about most. Going by the Trello board, it looks like Caching is the next most interesting topic. So next time expect to learn how we cache data both on the web tier and Redis, how we handle cache invalidation, and take advantage of pub/sub for various tasks along the way.

